

In the heart-pounding final moments of a basketball game, when the score is tight and the clock ticks down, every dribble, pass, and shot can tip the balance between victory and defeat. These clutch situations, defined here as when teams trail by 5 or fewer points within the last 3 minutes of the 4th quarter, encapsulate the essence of basketball's drama and strategy. Drawing on a rich dataset of approximately 6,600 NBA games, this article delves into the pulsating world of clutch moments, exploring not just the frequency of these nail-biting finishes but the tactics teams employ to snatch victory from the jaws of defeat.
Our journey through the data reveals the proportion of games that feature these critical moments, offering a glimpse into how common—yet special—such situations are in the broader context of the NBA regular and post-season. By dissecting the dynamics of home and away team performances, we delve into the age-old question of home-court advantage and its impact on the likelihood of a comeback. Moreover, our analysis extends beyond win-loss outcomes to scrutinize the strategic choices made on the court, examining shot distribution, efficiency, and the role of free throws (if any) in these high-stakes moments.
The Essence of Clutch: Defining the Crucial Moments
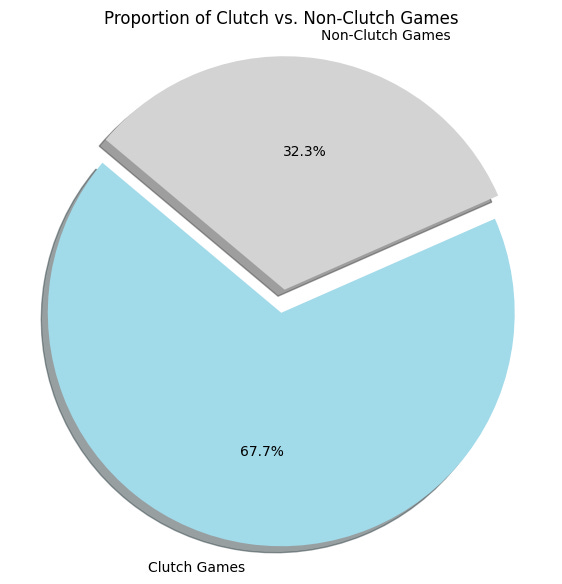
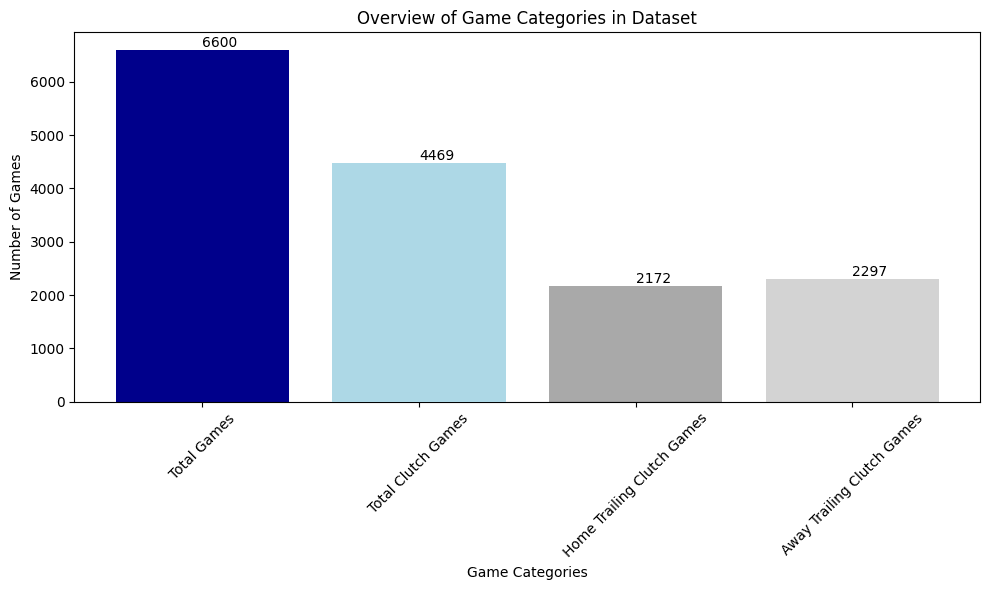
Upon analyzing approximately 6,600 games, our initial findings unveil that a significant portion of these contests enter such clutch moments. Specifically, 4,469 games featured situations fitting our clutch criteria, translating to about two-thirds of the matches analyzed. This high incidence underscores not only the competitive balance within the league but also the frequent occurrence of scenarios where outcomes hang delicately in balance until the final buzzer.
Home vs. Away: The Comeback Battle
In clutch moments, the distinction between playing at home versus on the road becomes starkly apparent. Out of 4,469 clutch scenarios in our dataset, 2,172 instances where the home team trailed by 5 or fewer points within the last 3 minutes of the 4th quarter, compared to 2,297 instances for the away team. The question at the heart of this investigation: does the home-court advantage play a significant role in a team's ability to orchestrate a comeback?
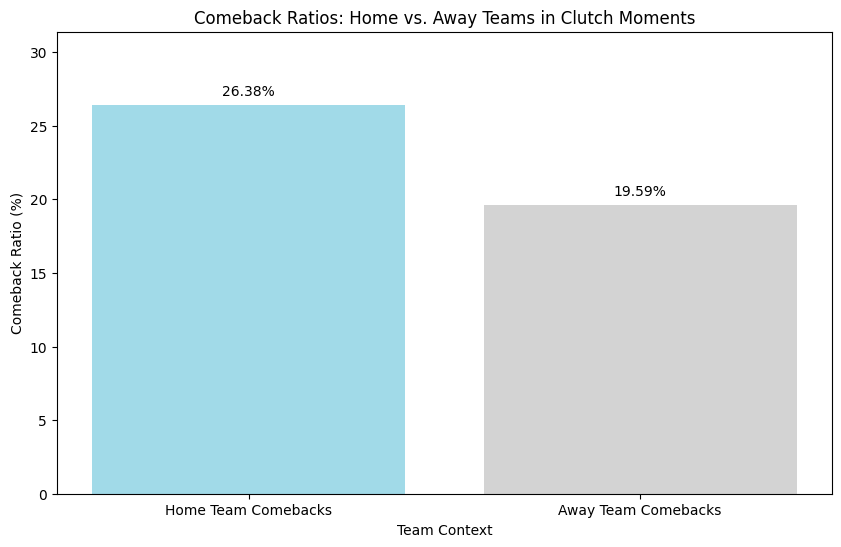
Upon examining the outcomes, we discovered that home teams managed a comeback in approximately 26.4% of their clutch scenarios, while away teams succeeded only about 19.6% of the time. This differential not only underscores the psychological and strategic edge of playing on familiar territory but also highlights the tangible impact of home support in tilting the odds during game-defining moments.
Shot Distribution: Tactics Unfolded
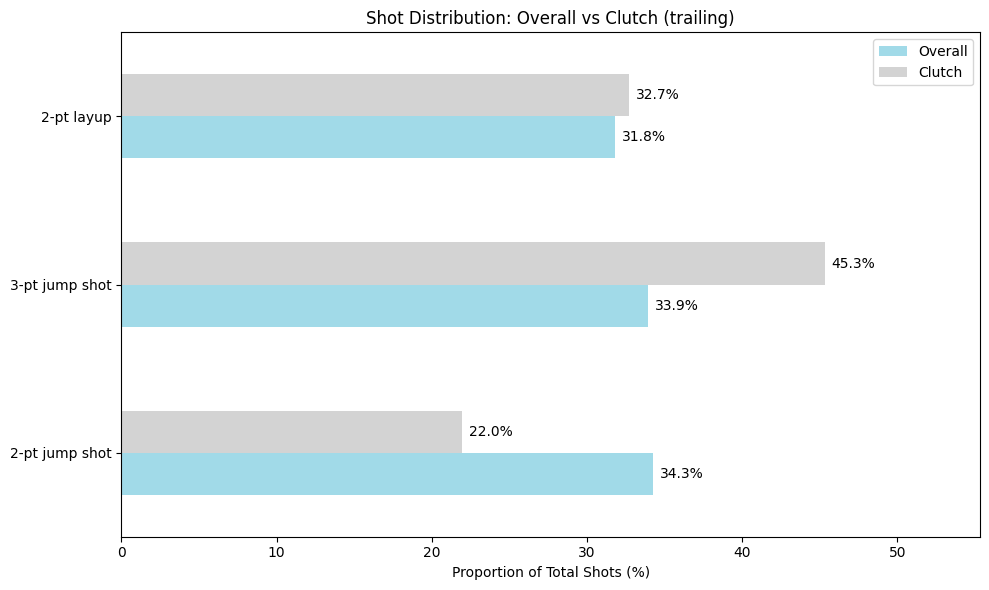
Our comprehensive analysis of the shot types across the entire dataset, containing more than 1.14 million shots, has revealed a remarkably balanced trichotomy. 2-point jump shots account for roughly 34.3% of all attempts, 2-point layups (including dunk and tip-in) for 31.8%, and 3-point jump shots closely follow at 33.9%. This distribution not only reflects the strategic diversity in the league but also underscores the evolving nature of the game where the three-point shot is just as prevalent as the time-honored layup.
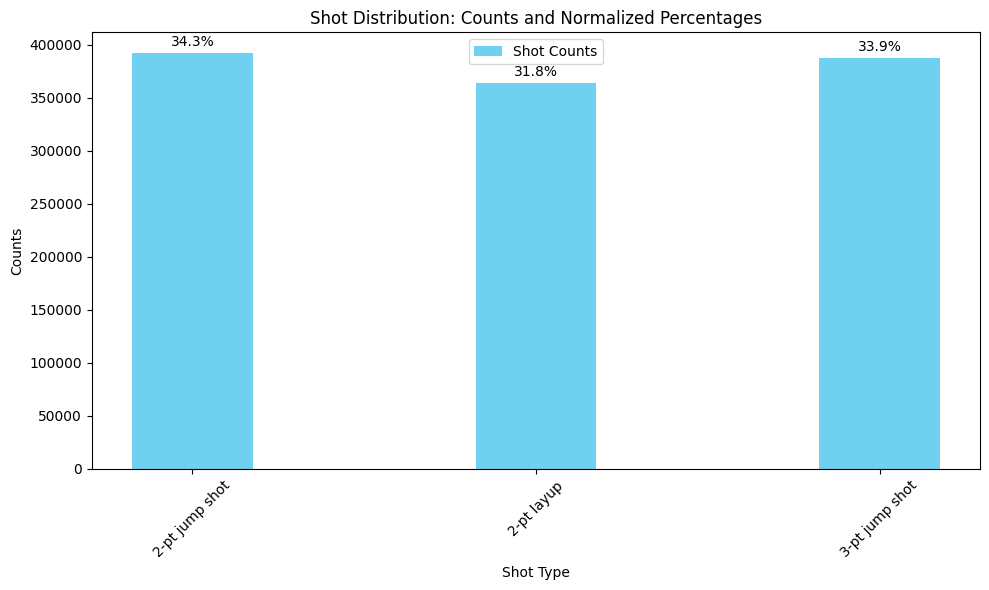
These numbers set the stage for a deeper exploration into clutch moments, inviting us to examine whether teams cling to their shooting habits or pivot drastically.
As expected, we can observe a striking shift in shot selection during clutch moments by trailing teams, as depicted in the below chart. It can be attributed to the urgency of chasing points with limited time remaining on the clock. Teams prioritize three-point jump shots, which account for a substantial 45.3% of their attempts, a clear indication that they are strategically opting for plays that can yield higher points per shot.
Next, we decided to look at the shooting percentages during these critical clutch moments, juxtaposing them with the regular season averages. In clutch situations, trailing teams make 33.62% of 2-point jump shots and 59.70% of layups, but 3-point accuracy significantly drops to 31.38%, below the 5-season average of 36.14%. This decline likely results from a higher volume of attempts that may not always be the most open or high-quality opportunities, and more defensive pressure towards the end of the game. The decrease in shooting efficiency has a tangible impact on the expected value of each 3-point shot (from 1.083 using 5-season average to 0.941 points in clutch situation when trailing).
Next, we'll explore whether this approach pays off for teams attempting to stage a comeback.
The Anatomy of a Comeback
In dissecting the strategies of NBA comebacks, it becomes evident that the commonly perceived approach of ramping up three-point attempts during clutch moments (espacially with lower shooting efficiency) does not emerge as the winning formula. This insight aligns with our earlier observation that teams trailing in clutch moments increased their three-point attempts from 33.9% to a staggering 45.3%, only to suffer a decline in shooting efficiency.
The successful teams, however, took a different path. Their shot distribution maintained a closer resemblance to regular gameplay, with a balanced mix of three-pointers (34.8%) and a pronounced focus on two-point layups (39.8%). It wasn't the sheer increase in volume of three-point shots that paved the way to victory, but rather a calculated shot selection that leveraged the higher expected value of layups. With a 51.64% success rate on layups, these teams optimized their scoring efficiency, highlighting the importance of shot quality over quantity in high-pressure scenarios.
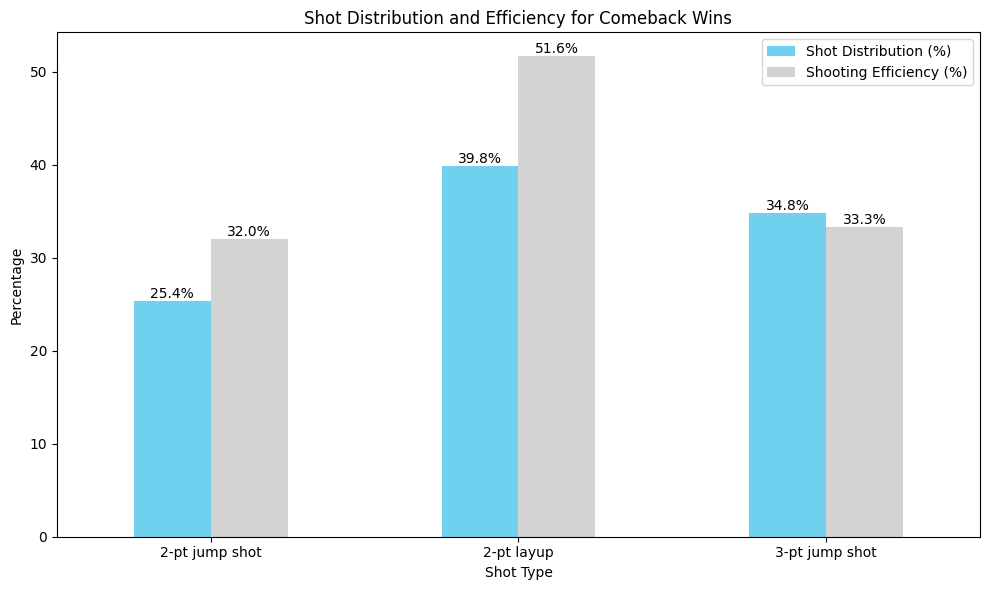
This strategic insight challenges the conventional clutch-time mentality, suggesting that a disciplined approach to shot selection, favoring higher-percentage attempts, may be a more reliable route to overturning deficits and clinching victories.
The Surprising Role of Free Throws in Comeback Scenarios
Contrary to conventional wisdom that free throws significantly contribute to the dynamics of a successful comeback by providing high-percentage points and stopping the game clock, our analysis suggests a more nuanced reality. Across the entire trailing clutch scenarios, teams averaged 2.54 free throw attempts per game at a success rate of 77.25%. Surprisingly, in games where comebacks were successfully mounted, these numbers slightly dipped to an average of 2.30 attempts per game at a 75.29% success rate. This data indicates that, despite the inherent advantages of free throws, their impact on the outcome of comebacks might not be as substantial as previously thought. While every point counts in the clutch, strategies beyond the free-throw line are equally crucial in flipping the scoreboard in a team's favor.
In summary: Our analysis of 6,600 games unveils that successful comebacks hinge less on the expected increase in 3-point shots and more on strategic shot selection, particularly favoring layups. Contrary to the conventional belief in the pivotal role of free throws for their high-percentage points and clock-stopping capability, our findings suggest their impact on comeback victories might not be as significant as previously thought. The essence of clutch moments, therefore, does not solely revolve around ramping up three-pointers or free throw attempts but in a balanced approach that emphasizes the higher expected value of layups. This insight challenges traditional strategies, highlighting the nuanced tactics teams employ in the adrenaline-filled final minutes to alter the game's outcome.
Disclaimer: The essence of data analysis is not to capture the entirety of the story but to piece together a narrative from the data fragments at hand. While the data utilized herein is robust and comprehensive, it's not exhaustive. Every statistical representation has its constraints. Our aim is to utilize accessible data judiciously, aiming for an honest and insightful interpretation, recognizing that there are always more layers to the story.
Thanks for your comment Habetyes. Indeed, the trailing team is the team that was behind at the beginning of the last 3 minutes. However, only shots when the points differential was negative for this team was taking into account.
Curious how situation are handled where both teams trade leads in clutch time. Would they both increment the home/away games metrics or is the “trailing” team the team who is the first trailing team in the last 3 minutes?