
Beyond the Court: Assessing Player Value with Advanced Analytics

To evaluate the overall impact of an NBA player, traditional statistics have often fallen short, prompting the need for more nuanced and comprehensive metrics. The latest analytical advancements have introduced more sophisticated methods. We decided to use Efficient Offensive Production (EOP) and a reengineered version of the Defensive Rating that we called Defensive Impact Score (DIS) to better evaluate player contributions on both ends of the floor. This article explores the limitations of conventional measures such as Net Rating (NETRTG) and delves into a formula that encapsulates a player's true value to their team—the Overall Player Value (OPV).
The Offensive Contribution
Stephen Shea and Christopher Baker developed (in their book “Basketball Analytics”) the Efficient Offensive Production (EOP). Before we can delve into the intricacies of EOP, we must first understand Offensive Efficiency (OE). The authors stated that they “believe efficient players make for efficient teams, and efficient teams win” and we could not agree more. Their statement is later demonstrated in their book where the regression from OE to WIN% for seasons between 2003 and 2013 has an R-squared of 0.44 when it is only 0.15 for the regression from points per game to WIN%.
OE serves as a crucial intermediary metric, assessing a player's effectiveness in generating points. Calculated as the sum of a player's field goals and assists, divided by their total field goal attempts minus offensive rebounds plus assists plus turnovers, OE encapsulates the essence of offensive contribution in a single figure. We decided to enhance the original formula by including screen assists.
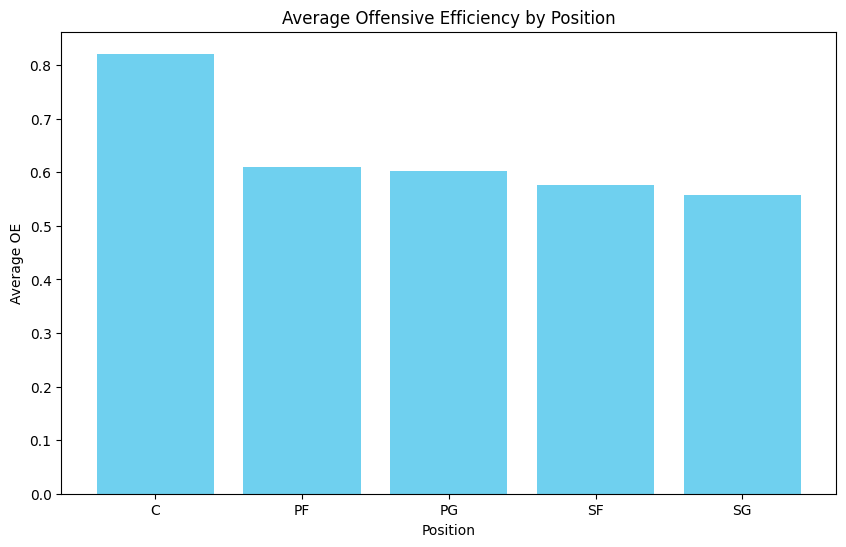
From the above bar chart, we can observe the average OE per position for NBA players playing more than 15 minutes per game this season. These averages logically suggest a pattern where positions traditionally closer to the basket (centers and power forwards) tend to have higher Offensive Efficiency, due to higher FG%, more offensive rebounds and screen assists, and less prone to turn the ball over. In contrast, positions that operate more on the perimeter (espacially shooting guards and small forwards) show lower OE, due to more ball handling potentially leading to a turnover, less offensive rebounds and lower FG% (perimeter shots). Hence, it is important (in our opinion) to compare a player’s OE with the average for his position and not only looking at the absolute value.
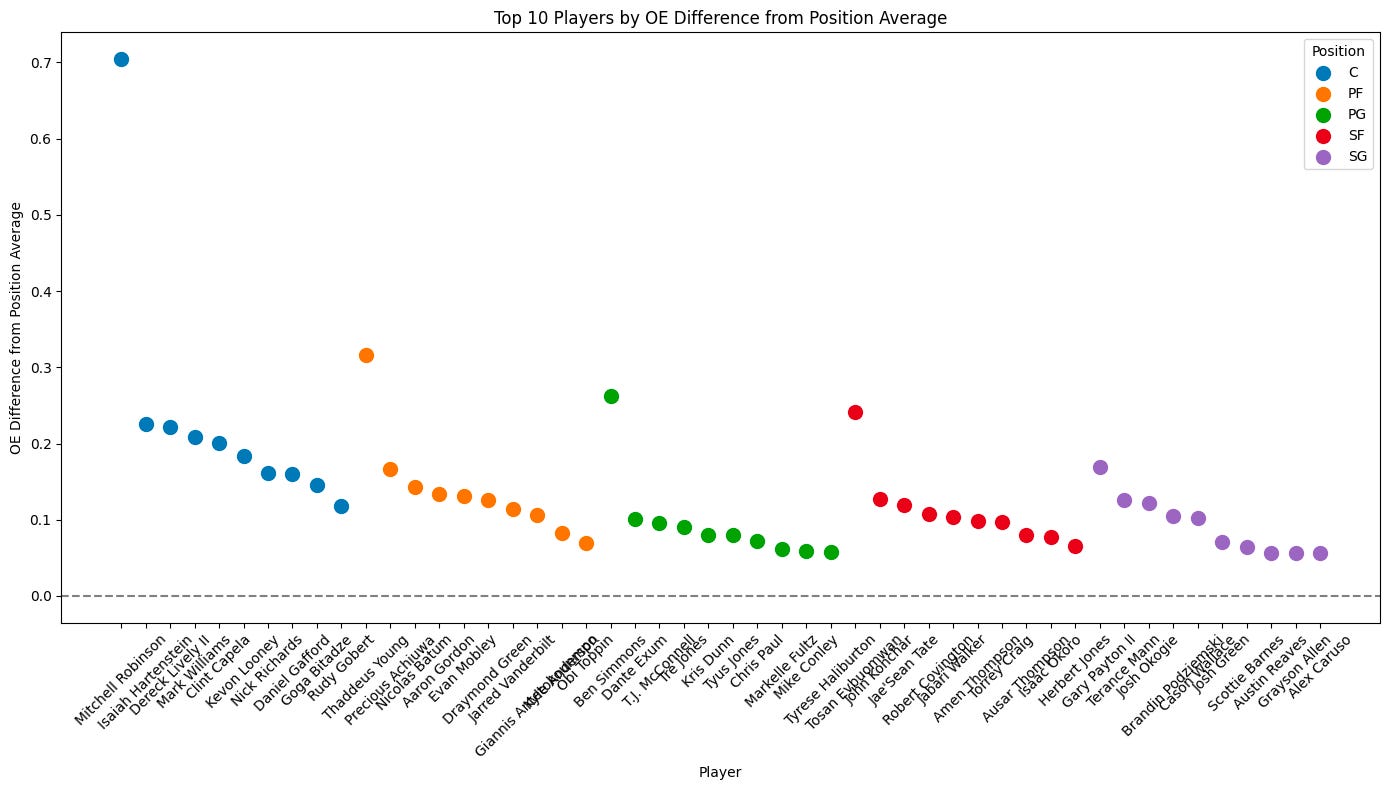
Above are the top 10 outperformers (difference between OE and position average OE) per position. And apart from some well-known stars like Giannis Antetokounmpo, Rudy Gobert, or Tyrese Haliburton, most of the names in the above scatter plot are relatively unknown to the general public. This observation is understandable, as top-tier players often shoulder a heavier offensive load, necessitating more shot attempts, including those that are heavily contested or executed under high-pressure situations like the last seconds of a possession or critical moments of a game.
This is for this reason that OE is only an intermediary metric. To get a more complete measure of the offensive production, the authors decided to incorporate points scored and the value of an assist relative to a point scored (0.76). EOP is then calculated as OE multiplied by the result of 0.76 times a player’s assists plus his amount of points scored.
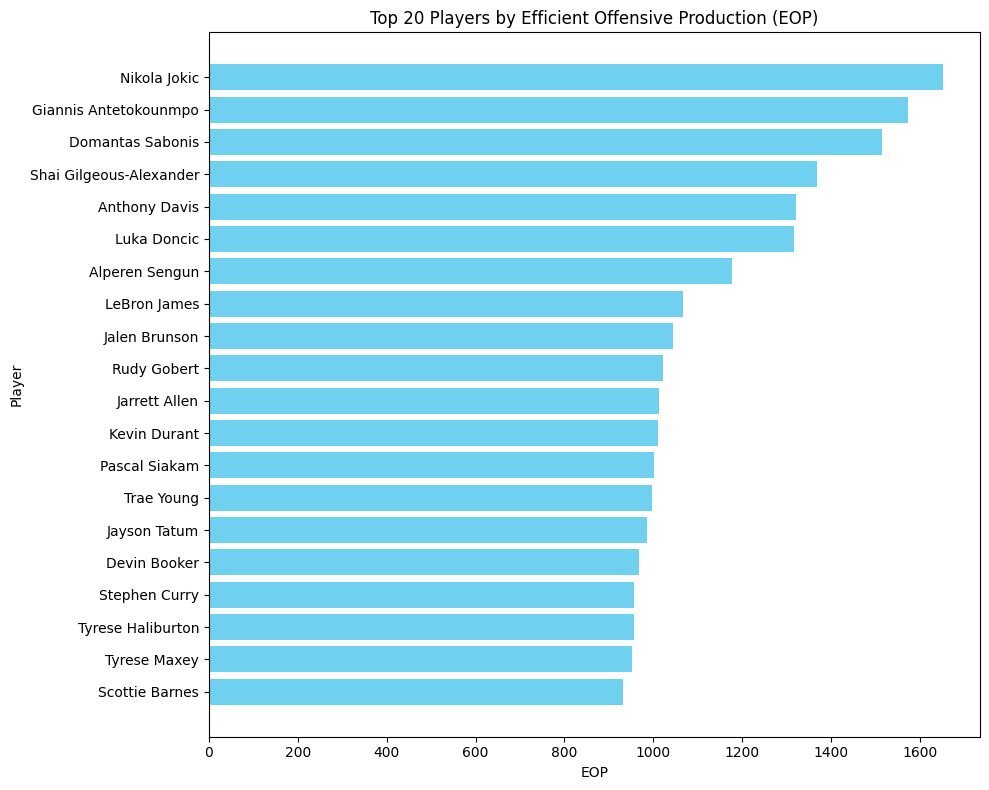
When looking at EOP, names become more familiar. With Nikola Jokic leading the way (26.1 pts, 12.3 reb, 9 ast per game, shooting at a 58.1% this season). Since not all players played the same amount of game this season (injuries, suspensions…), we thought it would be interesting to look at the EOP per game and below is the 20 players with the highest EOP per game this season.
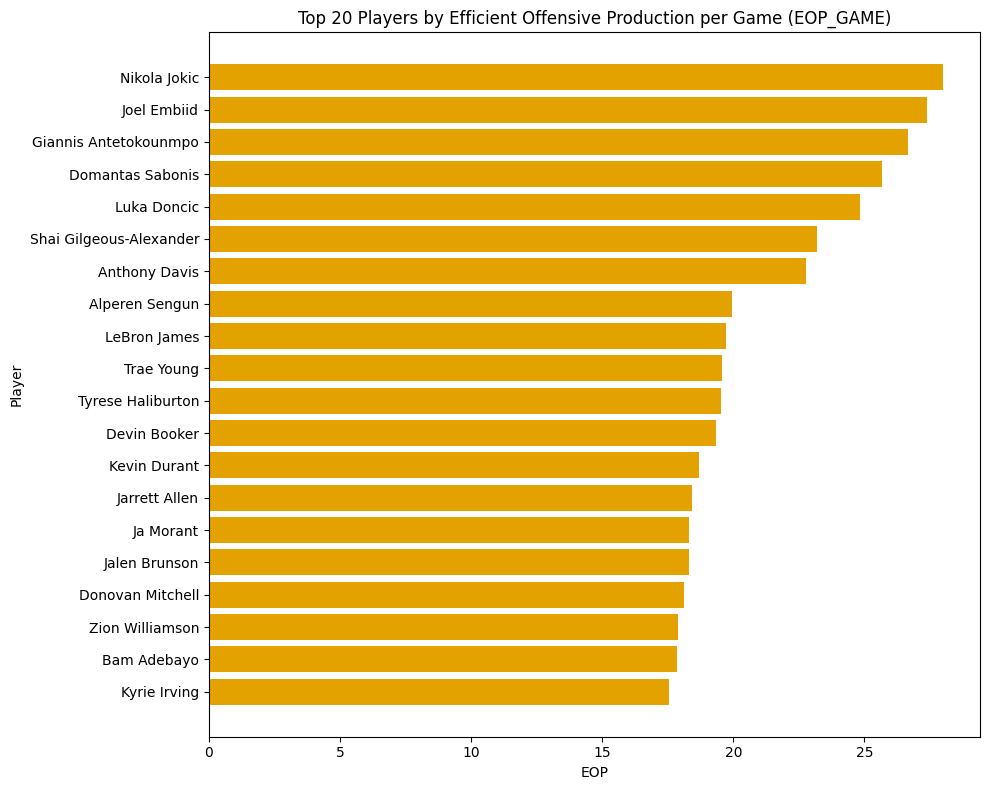
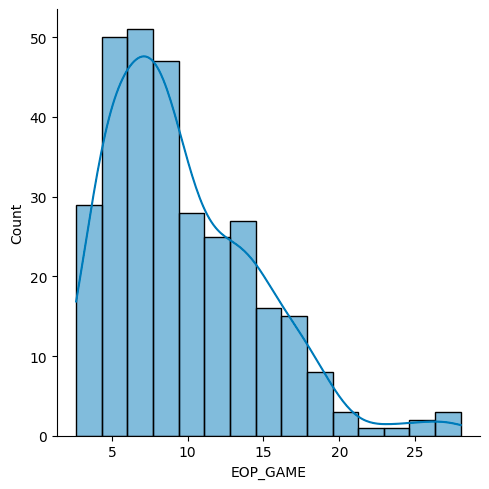
We all became used to Nikola Jokic almost averaging a triple double for the season, Luka Doncic and Shai Gilgeous-Alexander dropping constantly more than 30 points each night (SGA had 45 30-point games in the first 60 of his team, or 75%), or Lebron James having the highest EOP per game among small forwards in the NBA at 39 years old and after more than 20 seasons in this league. But we decided to plot the EOP per game distribution to really acknowledge how unique those players are.
The Defensive Contribution
The NBA's Defensive Rating (DEFRTG) is a metric designed to quantify a player's defensive effectiveness by estimating the number of points the player allowed per 100 possessions they defensively faced. In simpler terms, it measures how good a player is at stopping the opposing team from scoring. The lower the DEFRTG, the better a defender is considered, as it implies they allow fewer points.
Calculating DEFRTG involves a complex formula that accounts for various factors so to understand what drives this rating, we decided to run a correlation matrix between some defensive stats (opponent FG%, steals, blocks) and defensive hustle stats (deflections, charges drawn, constested shots).
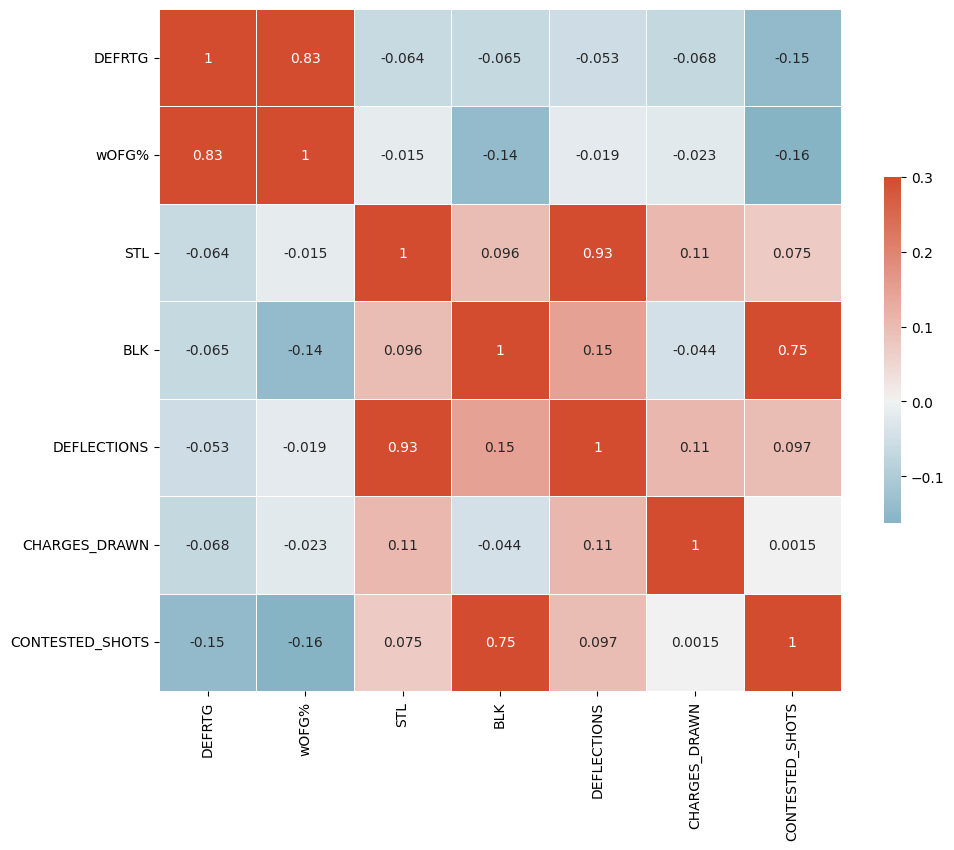
Keep in mind, a lower DEFRTG signifies a more effective defender. Therefore, it's expected to see a significant positive correlation of the latter with the weighted opponent field goal percentage (wOFG%). What's unexpected, however, is the lack of significance of almost all other metrics, apart from contested shots, in relation to DEFRTG. Key statistics such as steals (STL) and blocks (BLK) display almost no correlation with it.
In the broader context of a player's defensive value, we believe DEFRTG must be used alongside other statistics, such as steals, blocks, and defensive rebounds, to provide a comprehensive view of a player's defensive contributions leading to his team’s success. To confirm our belief, we looked at the relationship between DEFRTG and other defensive stats (at team level) with WIN%
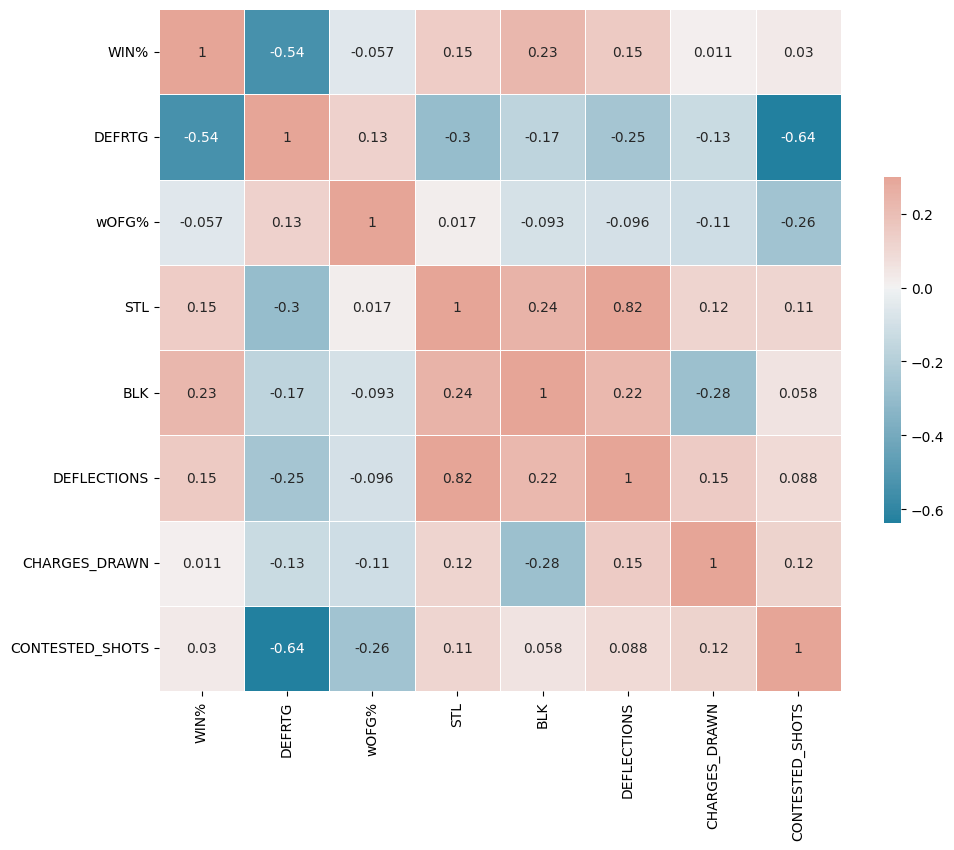
Although DEFRTG shows a notable inverse relationship with WIN% (indicating that lower DEFRTG typically corresponds to higher WIN%), other defensive metrics such as steals (STL), blocks (BLK), and deflections also play a role in determining a team's success.
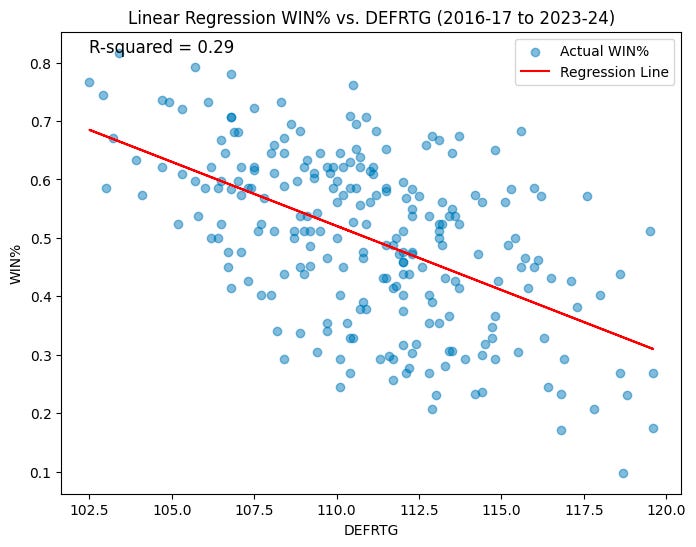
The first linear regression, with an R-squared value of 0.29, demonstrates that DEFRTG alone offers a partial glimpse into a team's winning potential.
In contrast, when running a multiple linear regression, we were able to improve the R-squared to 0.48 however, most coefficients (except DFRTG, blocks, and contested shots) were not statistically significant (p-value > 0.05). This is due to the presence of strong multicollinearity, and the estimated regression coefficients become unstable and difficult to interpret. To help dealing with multicollinearity we ran a Lasso regression since it penalizes the size of the coefficients and potentially reduce some coefficients to zero. The model reduced most coefficients to zero hence we will assume that DEFRTG significantly captures a player's defensive impact on their team’s win percentage.
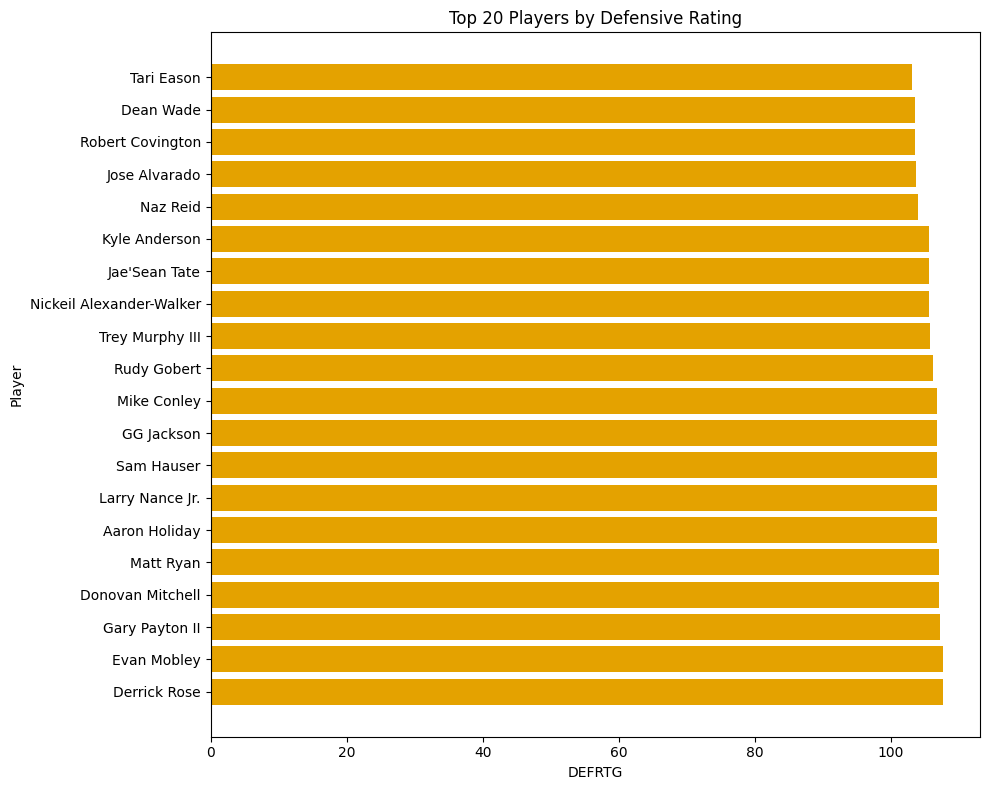
Surprinsingly, the favorite player to win Defensive Player Of the Year (DPOY), Rudy Gobert, is only 10th when looking at the DEFRTG. Victor Wembanyama is not even in the top 20.
Overall Player Value
To translate a player’s defensive prowess into a more intuitively understandable metric, we’ve reengineered the DEFRTG into a positively oriented scale, where higher numbers reflect stronger defensive performance. This rating is calculated by reversing the DEFRTG relative to its mean, so that a player’s score above the mean signifies superior defensive contribution. We’ve further refined this metric by normalizing it to have a mean of one, creating the Defensive Impact Score (DIS). Players with a DIS greater than one are considered to have above-average defensive impact, while those below one are below-average.
It was a crucial step to compute an Overall Player Value (OPV). We can multiply EOP and DIS to synthesize a singular value that encapsulates a player's total contribution. Indeed, it gives us a nuanced perspective of a player’s value, rewarding those who excel offensively and defensively. It ensures that a player's overall impact isn’t totally skewed by proficiency in just one aspect of the game but is instead a balanced reflection of their abilities on both ends of the court.
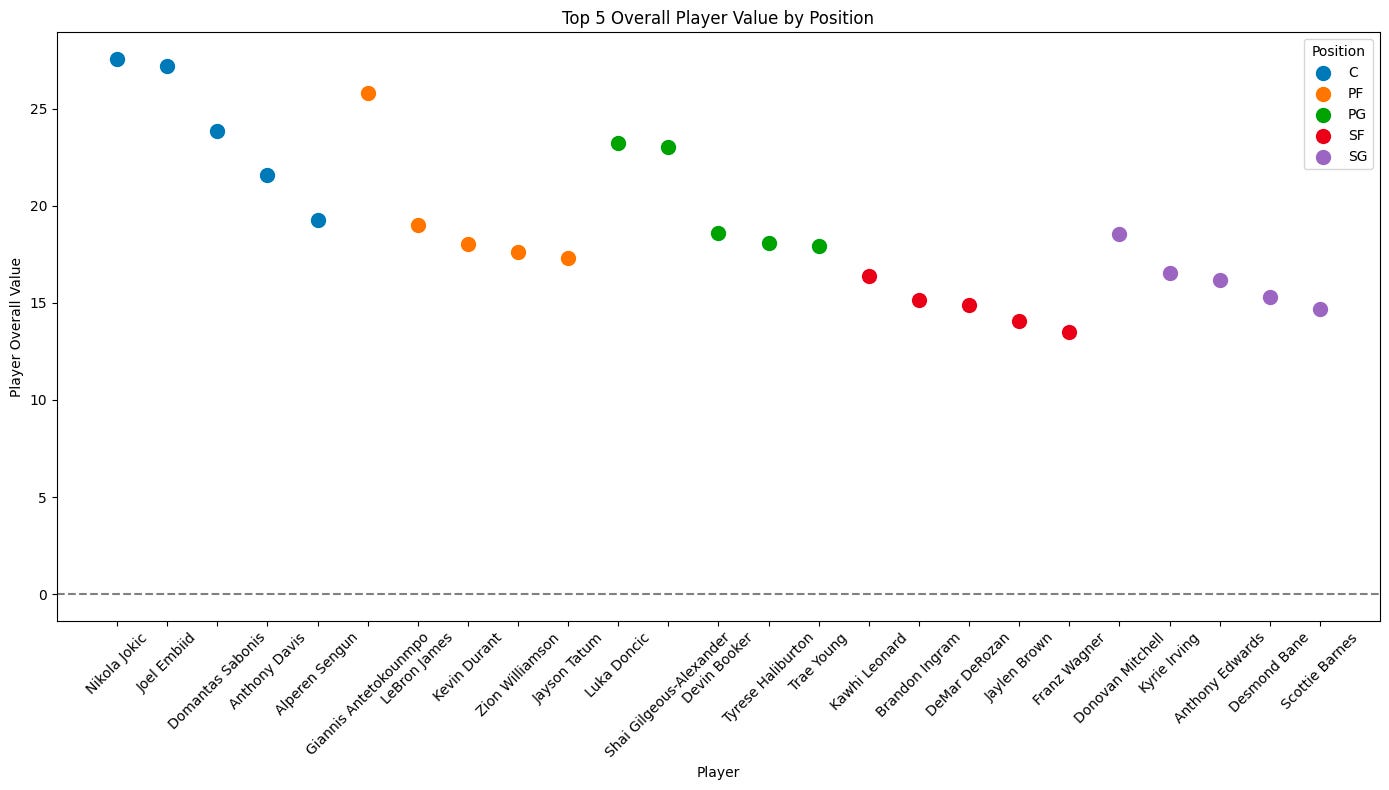
From the plot, we observe that while the top players remain relatively consistent in rank when comparing solely by EOP, incorporating the DIS adjusts the overall player valuation to reflect both offensive and defensive contributions. For instance, players like Nikola Jokic and Joel Embiid lead among centers, with their OPV reflecting their dominant two-way play.
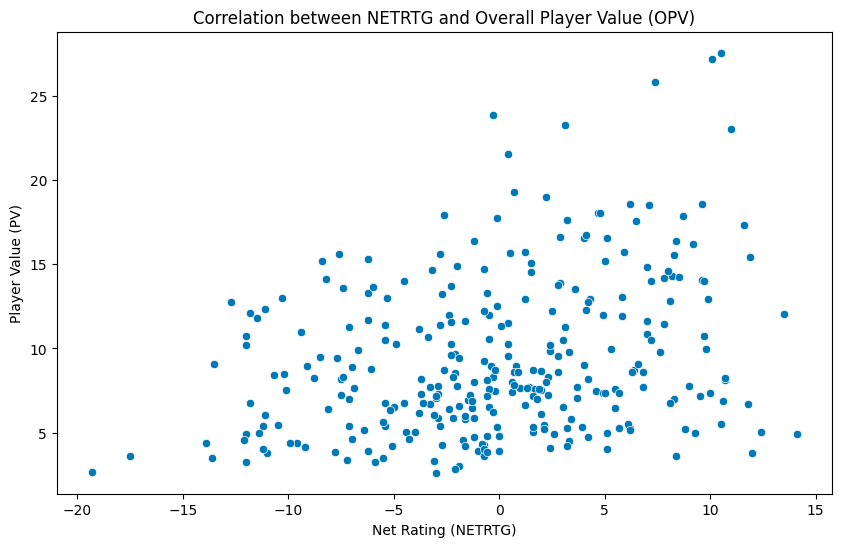
The NBA provides us with a Net Rating (NETRTG) being simply the difference between OFFRTG and DEFRTG. On player level, this statistic is the team's point differential per 100 possessions while they are on court. So why not simply use it as the overall value of a player?
The moderate correlation between EOP per game and OFFRTG suggests that while the metrics are related, OFFRTG is only one part of a larger offensive picture. Conversely, the lower correlation between NETRTG and OPV, implies that NETRTG might not fully capture an individual player's contribution to a team's success. Specifically, it may overlook the nuanced ways that a player's efficient scoring and defensive actions contribute to winning games.
A deeper dive into the discrepancy between players' NETRTG and their OPV rankings reveals intriguing patterns. We noted that players marked in green in the below chart, who exhibit higher OPV rankings compared to their NETRTG, predominantly belong to teams with losing records. This suggests that NETRTG can be significantly swayed by the team's overall performance, which is less reflective of individual contribution as evidenced by their OPV. For instance, players like Desmond Bane and LaMelo Ball find themselves well within the top 40 for OPV, despite being ranked 245th and 267th, respectively, by NETRTG among qualified players.
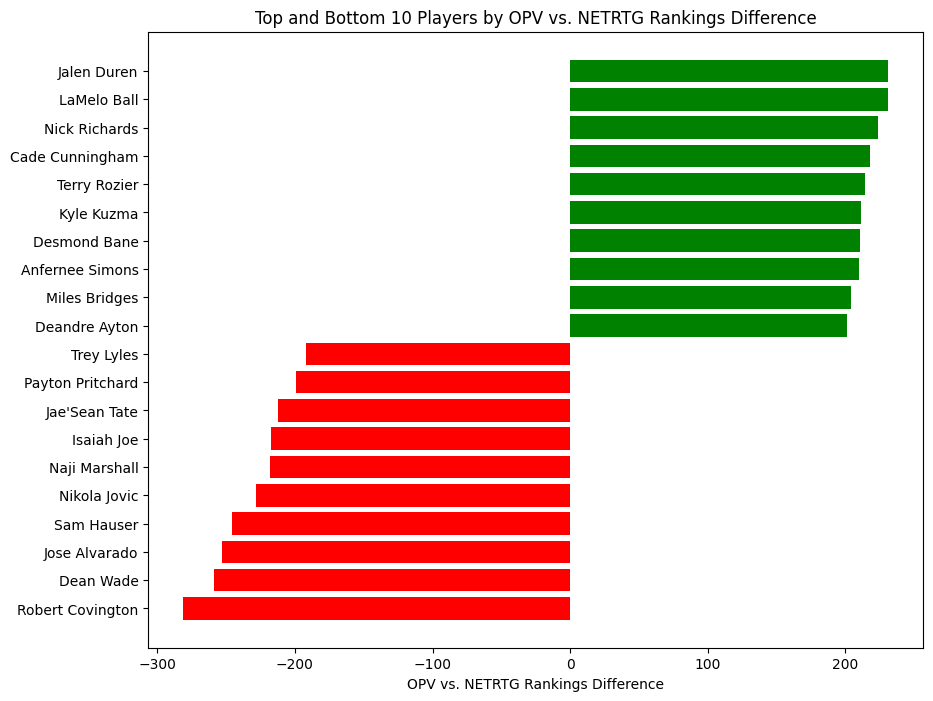
On the flip side, those with negative differences are typically associated with winning franchises (yes even Jae'Sean Tate from the Houston Rockets). Payton Pritchard of the Celtics serves as a case in point: his high NETRTG benefits from the team's success. We believe Pritchard has a spot in every NBA team’s roster, he is an offensively efficient player with average defensive impact but his engagement in the game is relatively low, with an average of just under three shot attempts per game, raising questions about whether his efficiency and NETRTG would hold up with a larger role. He ranks 6th in NETRTG but only 205th in OPV. Similarly, Jose Alvarado's defensive reputation is well-known, yet his offensive production falls (very) short.
While the value of a solid role player cannot be overlooked, our analysis suggests that OPV offers a more nuanced view, distinguishing between up-and-coming talents in challenging situations, such as LaMelo Ball and Cade Cunningham, and crucial role players like Pritchard and Sam Hauser, who contribute to a title-contending team.
In summary, our analysis highlights the nuanced complexities of measuring a player’s true value. While NETRTG offers a broad view, influenced significantly by the team’s overall success, our exploration into the OPV provides a more individualized perspective. This metric affords a multifaceted look at player performance, acknowledging the essential roles of players in various contexts.
Future Direction: our next step in a future article would be to juxtapose players' roles and OPV against the backdrop of their contracts with the aim to discover potential under- and over-valued players, contributing to a more informed and strategic approach to team building and player acquisition.
Disclaimer: The essence of data analysis is not to capture the entirety of the story but to piece together a narrative from the data fragments at hand. While the data utilized herein is robust and comprehensive, it's not exhaustive. Every statistical representation has its constraints. Our aim is to utilize accessible data judiciously, aiming for an honest and insightful interpretation, recognizing that there are always more layers to the story.