
Building a Contender - How the Four Factors Can Guide Roster Construction

In the NBA, the recipe for success often seems obvious: acquire stars, stack talent, and dominate. But history tells a more complicated story.
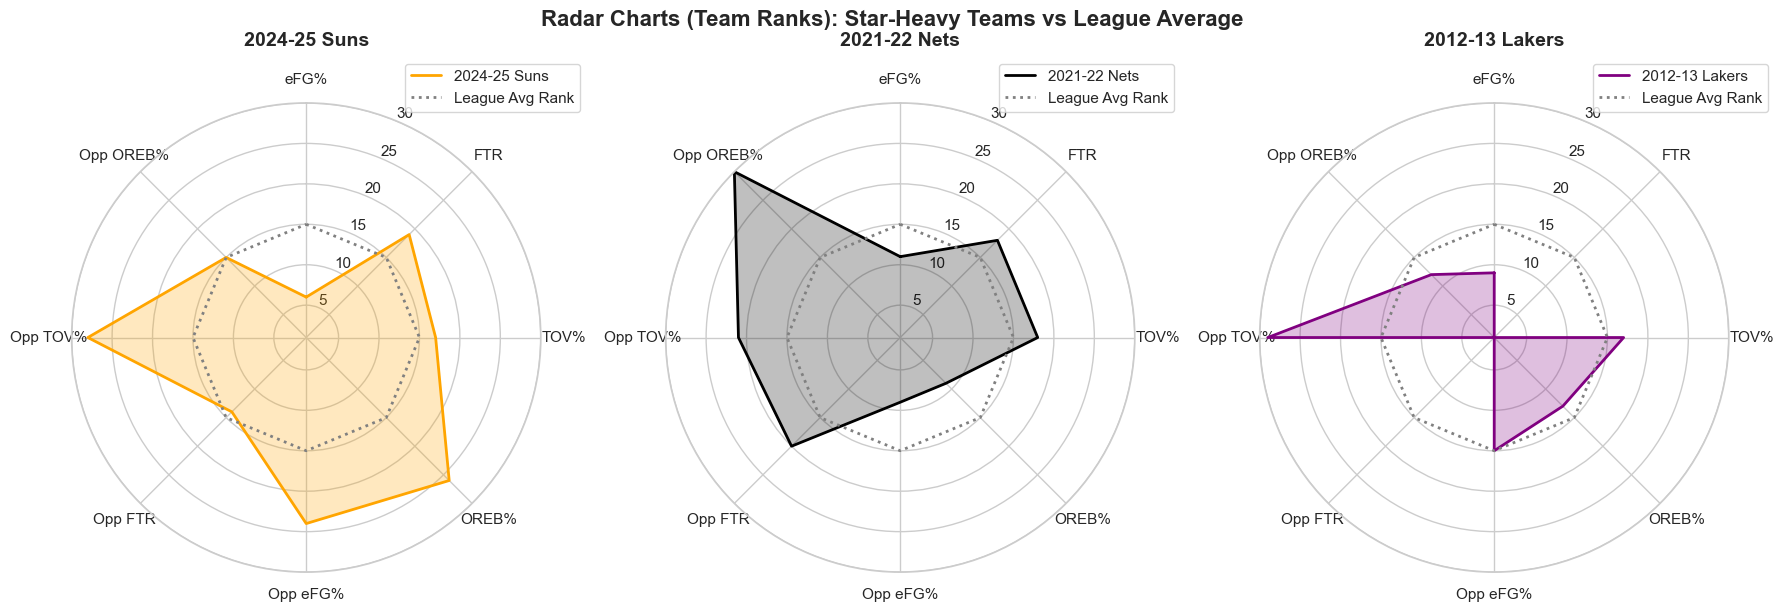
Just ask the 2012–13 Lakers (Kobe, Nash, Dwight, Gasol), the 2021–22 Nets (Durant, Irving, Harden), or more recently, the Suns (Durant, Booker, Beal). Despite headline-making rosters, none of those had success. They had the star power, but not necessarily the structure.
The truth is, winning consistently in the NBA isn’t just about who’s on the roster, but how a team performs in the margins: possessions, efficiency, discipline, and second chances. The below radar charts compare some star-heavy teams to league averages, and by the end of this article, those charts should make perfect sense.
We explore what actually drives winning through a data-driven lens and specifically the Four Factors of Basketball Success. We introduce the framework, test its validity in today’s game, and then use it to analyze a real-world challenge: the Los Angeles Lakers’ current center position problem.
Despite a late-season surge and a playoff appearance, the Lakers were exposed in the first round, revealing fundamental weaknesses that current star trio could not cover up. We show how the Four Factors can help identify these gaps, and how they can inform smarter personnel decisions moving forward.
Why Use the Four Factors?
Originally introduced by Dean Oliver in Basketball on Paper, the Four Factors provide a statistical framework that explains how teams win games. These aren’t exotic metrics but rather basketball fundamentals, quantified:
eFG% (Effective Field Goal Percentage): Measures shooting efficiency, giving extra weight to more valuable three-pointers.
TOV% (Turnover Percentage): How often a team loses possession.
OREB% (Offensive Rebounding Percentage): Ability to generate second-chance opportunities.
FTR (Free Throw Rate): How often a team gets to the line relative to shot attempts.
We use this model because it's simple, transparent, and most importantly, powerful. But does it still hold up in today’s faster, spacing-focused NBA?
Do the Four Factors Still Predict Winning?
While the four factors where introduced in the early 2000s, the game has evolved dramatically since then. We now live in the 3-point and spacing era, where offensive systems emphasize perimeter shooting and faster pace.
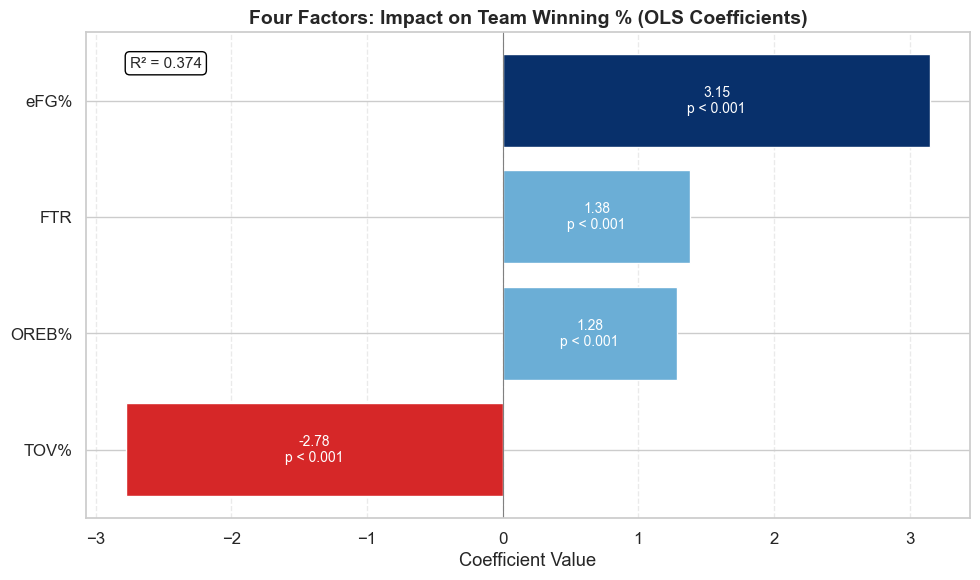
To test the continued relevance of the Four Factors, we ran an Ordinary Least Squares (OLS) regression using 15 seasons of team-level data (2010–11 to 2024–25), modeling winning percentage (W%) as a function of the Four Factors.
Despite being developed over two decades ago, the framework still holds strong in today’s NBA. Our regression shows that a simple linear combination of these four metrics explains 37.4% of the variance in team winning percentage, a strong result given the complexity of the sport.
Updated Factor Importance: A Modern Weighting System
Dean Oliver’s original model assigned fixed weights:
40% to eFG%
25% to TOV%
20% to OREB%
15% to FTR
To reflect the modern game, we recalculated these weights by normalizing the coefficients from our regression model over the past 15 seasons.
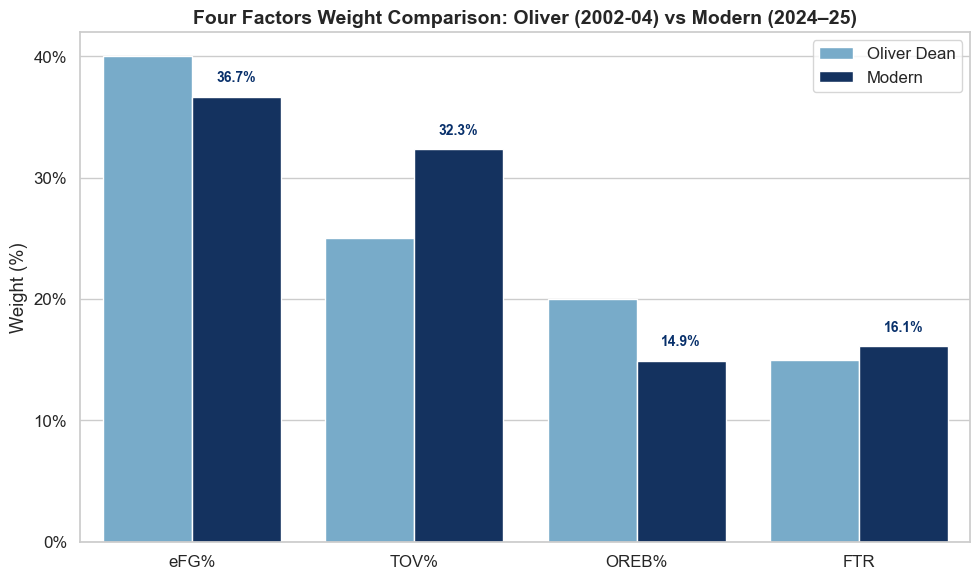
The comparison reveals both continuity and change in what drives winning. eFG% remains the most important factor, with nearly identical weight in Oliver’s model (40%) and ours (c.37%). The most significant shift is in TOV%, which now accounts for about 32%, up from 25%.
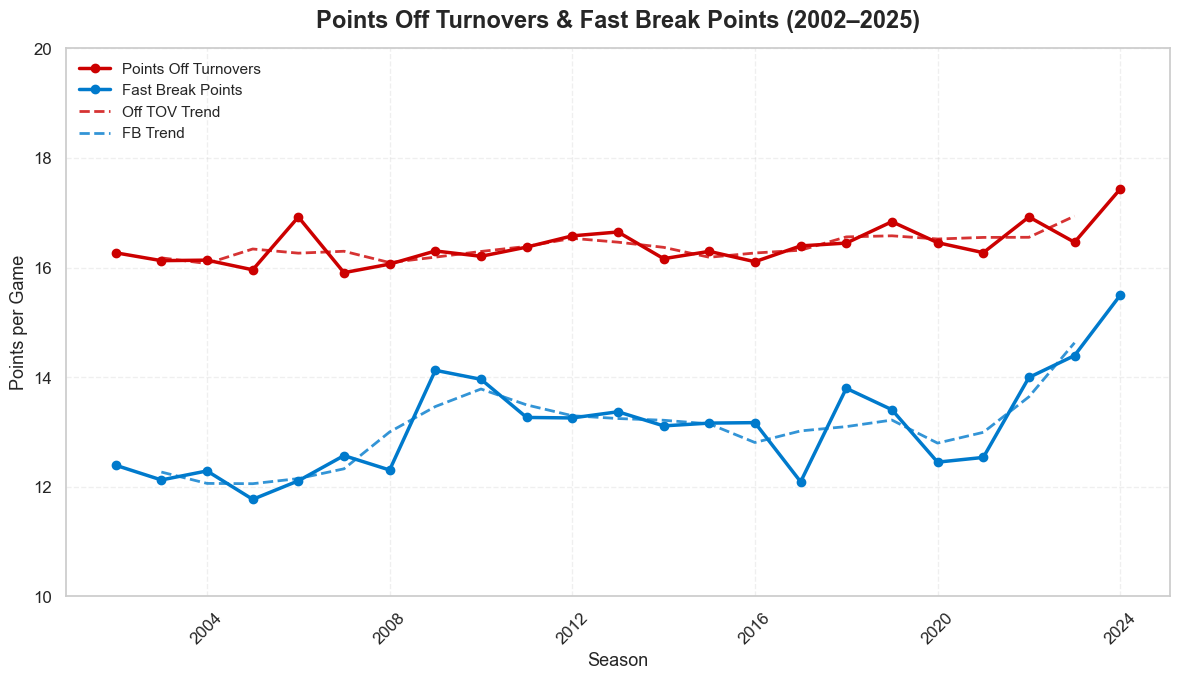
While points off turnovers have only modestly increased since the early 2000s, the sharp rise in fast break points (usually stemming from live-ball turnovers) suggests that giveaways are now punished more efficiently. With the game being faster, as reflected in the steady rise in fast break scoring, often resulting in high expected value shots, taking care of the ball has become more important than ever.
Meanwhile, FTA Rate has remained relatively stable, and OREB% has declined significantly, from 20% to just under 15%. This drop implies a strategic shift: teams now prioritize getting back on defense over crashing the offensive glass, trading off transition defense and efficient shot selection over second-chance opportunities.
The Four Factors framework doesn’t just explain offense, it also applies seamlessly to the defensive side of the ball, using opponent-based metrics to capture how well a team limits efficiency, controls possessions, and avoids costly mistakes. And just like on offense, these defensive factors show strong predictive power for winning.
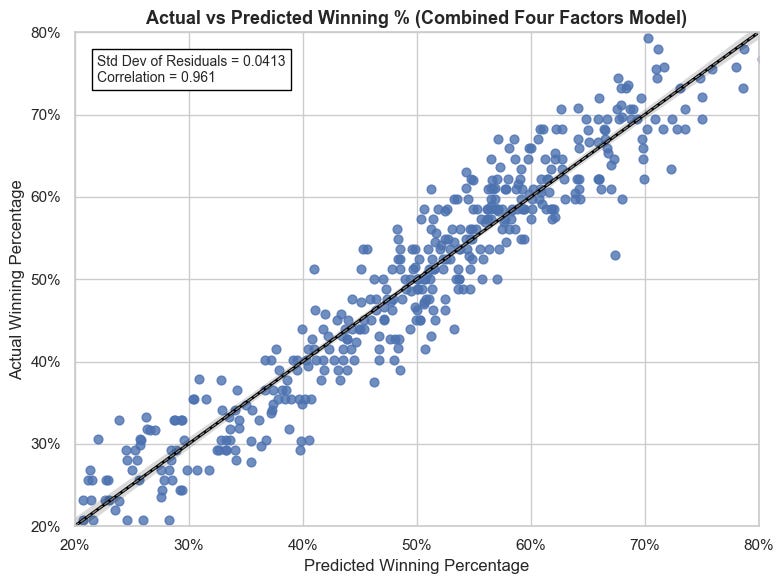
Our regression analysis using defensive Four Factors yields an R² of 36.7%, nearly identical to the offensive model (37.4%). This reinforces the idea that winning is a balanced equation, both scoring efficiently and disrupting the opponent’s ability to do so matter nearly equally. But the real power of the Four Factors emerges when they’re combined into a single model. The combined model achieves an R² of 92.4%, a remarkable jump in explanatory power. This shows that offense and defense are not just separate levers of success, but complementary pieces of a unified system that, together, offer a near-complete explanation of team performance.
To help bring this analysis to life, we’ve built an interactive dashboard that includes all the data used so far. You can explore the Four Factors and underlying stats for every NBA team/player across seasons, compare performance, and even dive into your favorite team’s trends. Click on the image below to access the dashboard and run your own analysis.

The Four Factors in Action: Solving the Lakers’ Center Problem
After the blockbuster Doncic–Davis trade reshaped the Lakers' roster midseason (and a failed medical voided their deadline deal for Hornet's Mark Williams) questions around the center position surfaced. Yet a late-season surge and a third-place finish in the West temporarily masked those concerns.
The playoffs, however, delivered a harsh reality check. Los Angeles was eliminated in just five games by the Timberwolves, exposing the roster’s underlying structural issues, particularly at the center spot.
Our Four Factors analysis confirms the story. Offensively and defensively, the Lakers remain highly efficient shooters (56% eFG% vs. 54% allowed) and excel at getting to the line (FTR of 27% vs. 23% for opponents). But they struggled throughout the season with Turnover Percentage (TOV%) and mainly Offensive Rebounding Percentage (OREB%), where they rank 27th in the league (and 21st with regards to OPP OREB%).
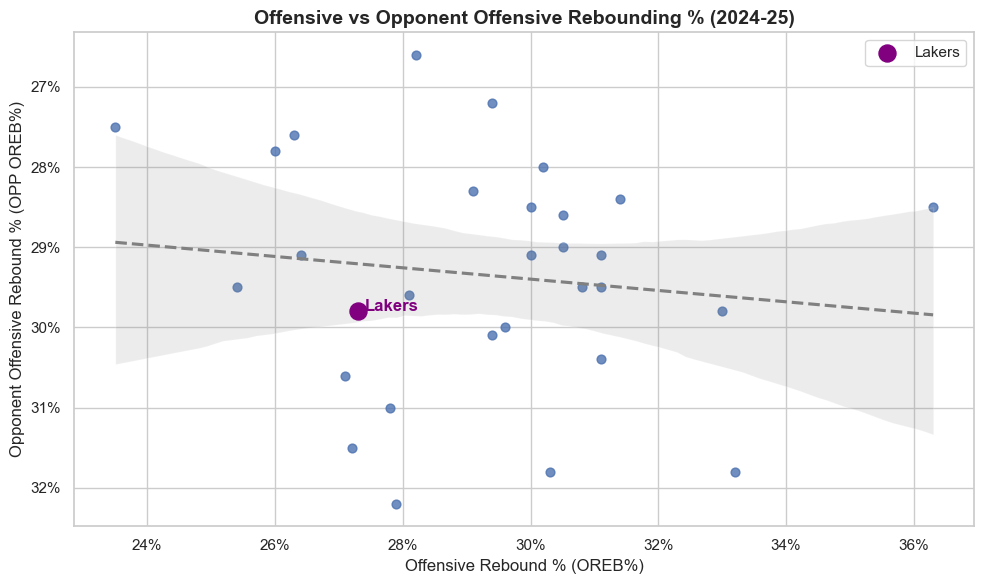
These weaknesses, while apparent in the regular season, became especially costly in the playoffs. The Lakers allowed the most opponent offensive rebounds (13.0 per game) and consequently gave up a league-high 18.8 second-chance points per game. They also ranked top three in points conceded off turnovers and fast breaks.
If the Lakers are serious about contending with a core of Doncic, LeBron, and Reaves, they’ll need to address this glaring hole.
Filling the Gap: A Four Factors-Based Assessment of UFA Centers
After reading Evan Massey’s 4 Realistic Center Options for the Lakers in 2025, we decided to apply our data-driven framework to evaluate the potential impact of each candidate. Using our Four Factors model, we assessed how each unrestricted free agent (UFA) big man would influence the Lakers’ performance, focusing on improving key weaknesses in offensive rebounding (OREB%) and turnover rate (TOV%), without sacrificing established strengths in shooting efficiency (eFG%) and free throw rate (FTR).
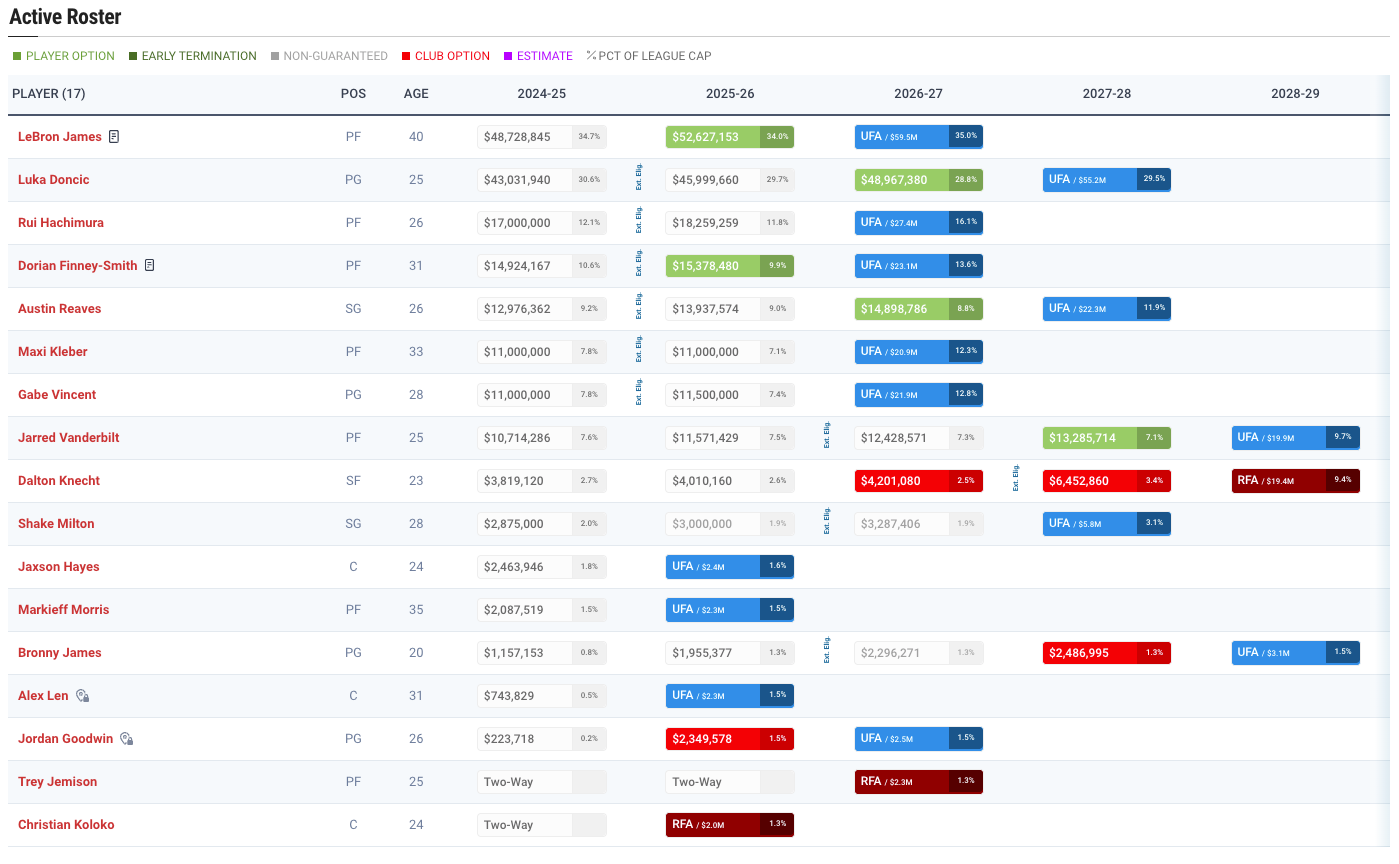
The methodology is simple, yet analytically powerful. We computed team-level Four Factors using the combined 2024–25 stats of the 11 Lakers currently under contract for next season according to Spotrac.
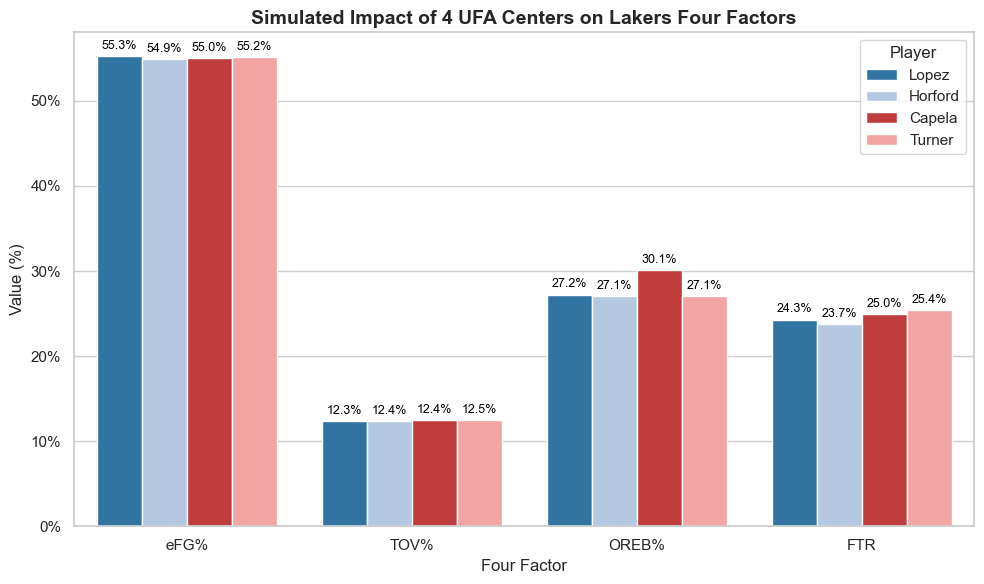
We then simulated the effect of adding each UFA center (Brook Lopez, Al Horford, Clint Capela, and Myles Turner) using their season totals, focusing on offensive contributions due to limited availability of opponent-specific player data, and holding opponent defensive rebounding constant based on the Lakers’ actual 2024–25 metric. While this approach doesn’t account for contracts, playing time, defensive schemes, or system fit, it offers a theoretical lens to understand marginal gains and trade-offs.
The results are telling, and based on the chart below, all four players provide marginal improvements across some metrics, but with varying strengths. Brook Lopez offers the highest shooting efficiency (eFG%) while modestly enhancing rebounding and turnover rates. Al Horford contributes slightly across the board but decreases the team’s free throw rate (FTR), one of their existing strengths. Clint Capela delivers the most significant boost in offensive rebounding (30.1%), the Lakers’ primary weakness, while maintaining balance in other areas. Myles Turner shows the most well-rounded profile with strong gains in eFG% and FTR, but offers less impact on offensive rebounding and a slight increase in turnovers.
Ultimately, while this is not a forecast or cap-informed model, it helps prioritize fit over name value, giving front offices a simple decision-support layer: plug the right holes without creating new ones.
Recommendation: Capela Checks the Boxes
Among the four UFA center options, Clint Capela emerges as the most logical fit for the Lakers in our opinion. He delivers the most significant boost to the team’s biggest weakness, offensive rebounding, pushing OREB% to 30.1%. He also slightly improves turnover percentage and maintains stability in shooting efficiency and free throw rate.
While others like Myles Turner offer more shooting range and all-around talent, his market value is likely to be high coming off a strong season with the Pacers, and his next contract could create cap pressure. Lopez and Horford bring valuable traits like floor spacing (both shooting around 37% from three this season) and playoffs experience, but at ages 37 and 39 respectively, they represent very short-term fixes. While their age may make them more affordable than in previous free agency periods, the impact of the aging curve can’t be ignored when assessing their long-term value to a contending roster.
In contrast, Capela is younger (will turn 31 in a few days), on a similar past contract to Lopez, and could be more affordable given his current team context. For a Lakers squad already rich in perimeter shooting (with Doncic, Reaves, James, Hachimura, Finney-Smith, Kleber, etc..), a traditional center like Capela who thrives on interior play and second-chance creation, while being a solid rim protector, could be the missing piece. He fills the need without creating new ones, and in a model grounded in the Four Factors, that’s the kind of efficient upgrade championship teams want to make.
In summary, winning in today’s NBA is about more than assembling stars, it’s about mastering the margins. Through the lens of the Four Factors, we’ve shown that shooting efficiency (eFG%), ball security (TOV%), offensive rebounding (OREB%), and free throw rate (FTR) still explain most of what drives success, but their relative weights have shifted in the modern era. Our model confirms their predictive power both offensively and defensively, and when combined, they provide a near-complete picture of team performance (R² = 92.4%).
Applied to the Lakers’ roster, the analysis highlights clear weaknesses in offensive rebounding and turnovers, both exploited in the playoffs. Among four free agent center options, Clint Capela stands out as the best fit according to us: he significantly boosts offensive rebounding while preserving the team’s existing strengths in eFG% and FTR.
The takeaway: identify what matters, measure it, and fill gaps without creating new ones. That’s how good teams become great.
Sources: NBA Stats, Basketball Reference, Spotrac.
Disclaimer: The essence of data analysis is not to capture the entirety of the story but to piece together a narrative from the data fragments at hand. While the data utilized herein is robust and comprehensive, it's not exhaustive. Every statistical representation has its constraints. Our aim is to utilize accessible data judiciously, aiming for an honest and insightful interpretation, recognizing that there are always more layers to the story.