


Decoding EuroLeague Positions - A Data-Driven Approach to Winning Rosters

In the era of positionless basketball, the traditional five-position model is becoming obsolete. The NBA has already begun reclassifying players based on skill sets rather than outdated positional labels, and, inspired by the work of Samuel Kalman, and Jonathan Bosch, we wanted to see if the same evolution is unfolding in the EuroLeague. Could a data-driven approach reveal new player positions that better define what actually leads to success? And beyond individual players, do certain roster structures consistently outperform others?
To answer these questions, we analyzed the last 10 seasons of EuroLeague data, classifying players based on their actual contributions rather than predefined positions. Then, we examined how different team constructions influence winning percentage (W%), looking for trends that could redefine how rosters should be built.
Identifying New Positions Based on Clustered Player Tendencies
Before diving into player clustering, we first need to ensure a level playing field. Basketball statistics exist on vastly different scales; a player's height (often over 190cm) and a shooting percentage (typically between 20-50%) don’t carry the same magnitude. Without proper adjustment, larger values would overshadow smaller but equally crucial stats. To prevent this, we normalized the dataset, ensuring that each metric contributed meaningfully to the clustering process.
With the data prepared, the next challenge was defining how many clusters would best separate players into distinct yet meaningful groups. We turned to the Elbow Method, a technique that identifies the point where adding more clusters no longer significantly improves differentiation. To further validate the groupings, we used the Silhouette Score, which measures how well-separated and distinct the clusters are, essentially confirming whether players within the same group truly belong together.
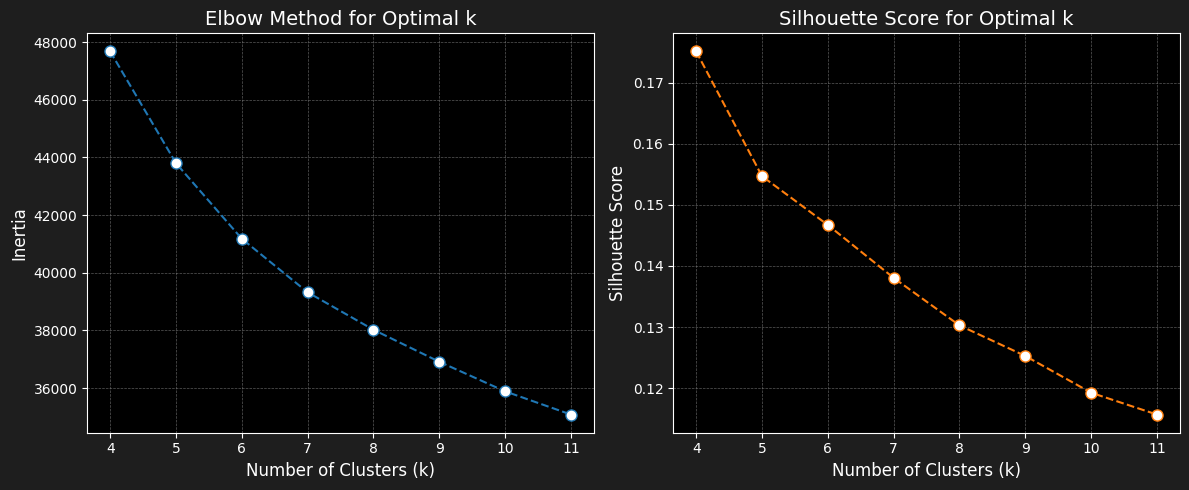
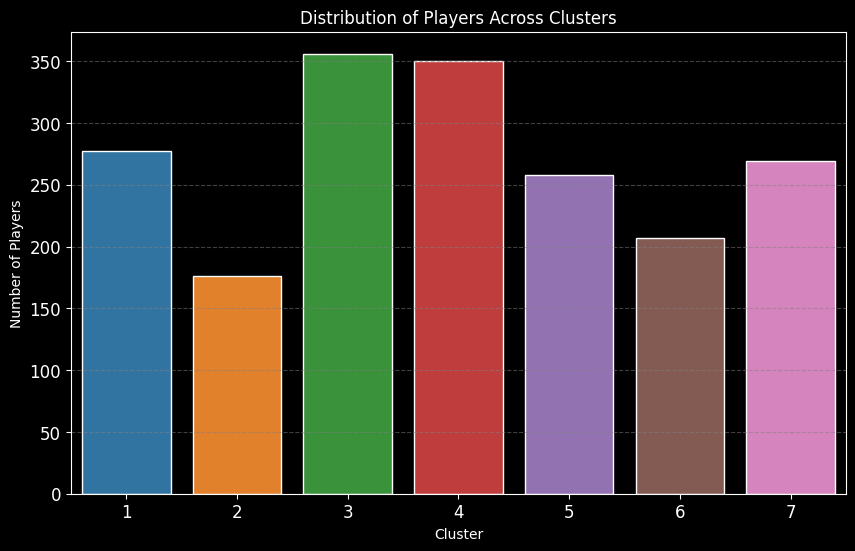
After testing different configurations, seven clusters emerged as the sweet spot, providing enough differentiation to highlight key playing styles while avoiding unnecessary complexity.
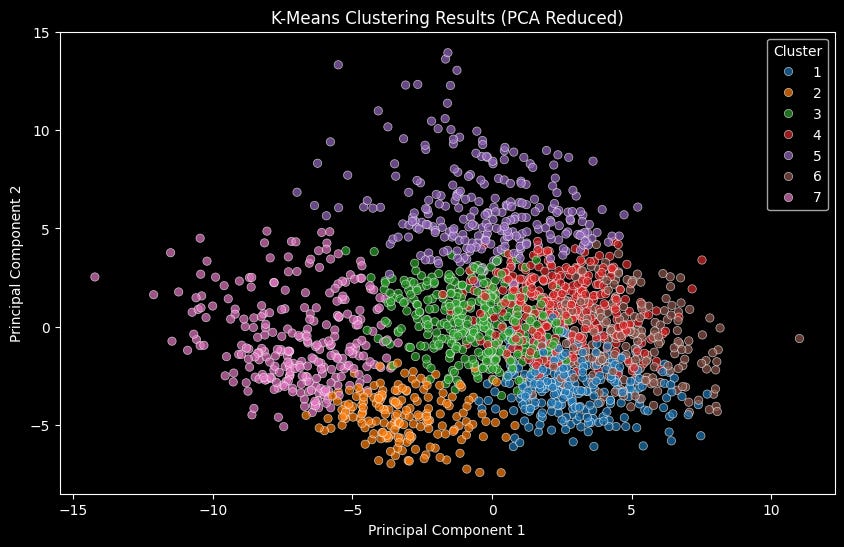
From there, we applied K-Means clustering, a machine learning algorithm that assigns each player to one of these groups based on their statistical profile. This step allowed us to group players not by their traditional positions, but by how they actually contribute on the court.
To make sense of these clusters visually, we used Principal Component Analysis (PCA) to reduce our dataset into two dimensions. With over 20 statistical features in play, reducing the data while preserving its most important differences helps reveal clear player groupings. On a 2D scatter plot, these clusters appear as distinct formations, offering an intuitive look at how different players align with one another based on their skill sets.
Once the clusters were established, the real insight began. By analyzing the defining characteristics of each group, we identified the top five and bottom five statistical features that set them apart (see example below). This step helps understand what makes each cluster unique, whether it's elite shooting, rebounding dominance, defensive versatility, or playmaking prowess. What emerges is a new way of classifying players, one that reflects the modern game far better than traditional position labels ever could.
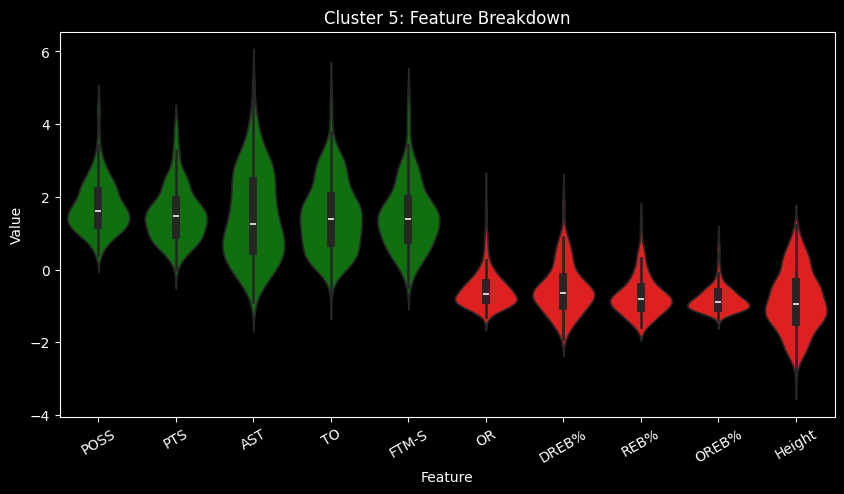
And with that foundation in place, let's break down the newly formed groups…
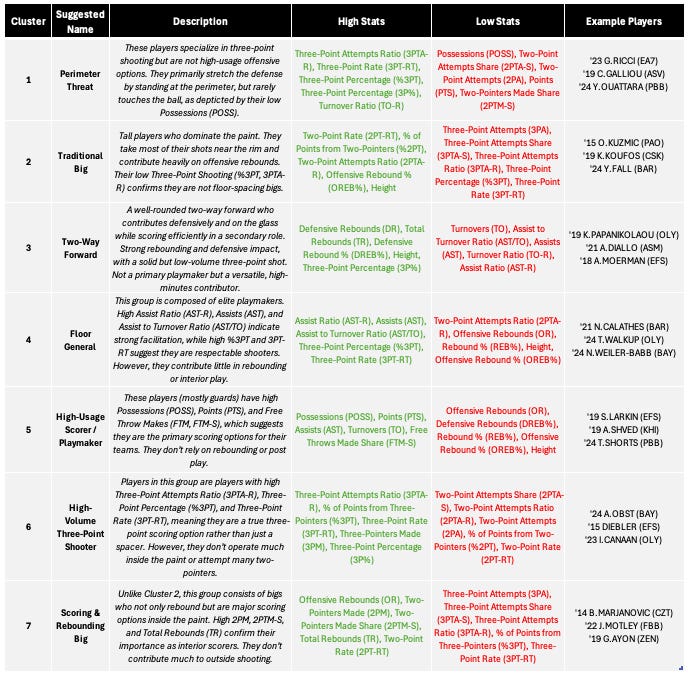
As we all know, basketball has long been defined by rigid positional labels (point guard, shooting guard, small forward, power forward, and center). But in today’s game, those designations often fail to capture the essence of what a player actually brings to the court. The above skill-based approach to classifying players opens up a far more interesting way to analyze the game.
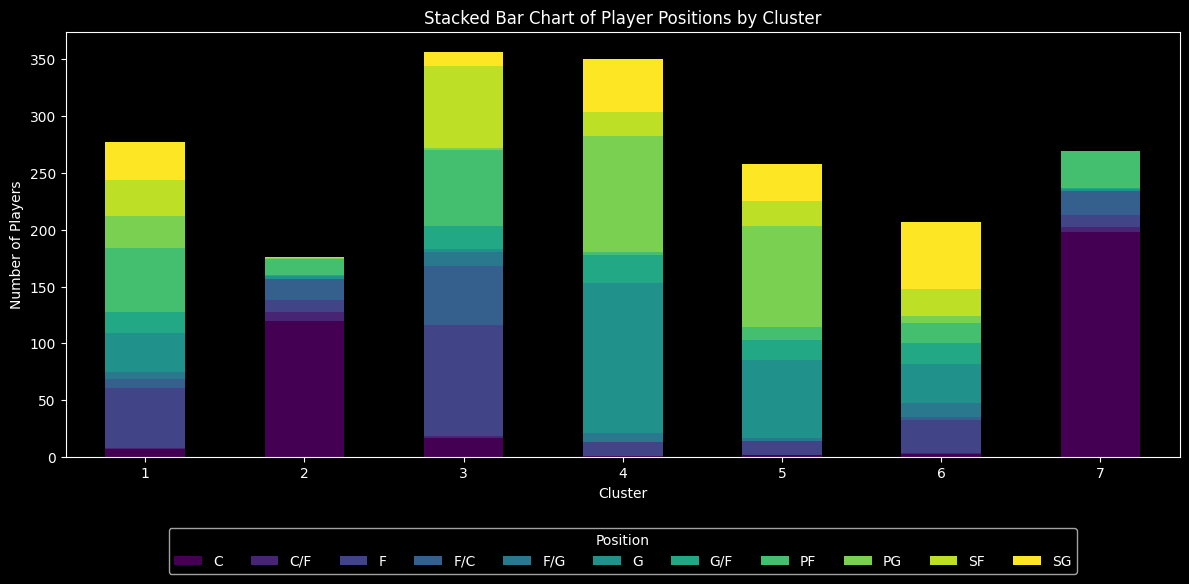
A playmaking, high-assist guard might belong to an entirely different group than a high volume-scoring guard, even though both historically play the same position. And while centers tend to show less differentiation (most falling into clusters 2 or 7) this approach still allows for distinctions between big men based on their offensive and defensive production. Instead of asking whether a player is a “good shooting guard,” the question shifts to whether they are an elite off-ball shooter, a defensive disruptor, or a secondary ball-handler. By rethinking how we categorize players, we move closer to a data-driven model that reflects the evolution of the sport, where versatility is king, and traditional labels are more misleading than they are helpful.
Analyzing Roster Construction In The EuroLeague
EuroLeague rosters in 2024 show a fascinating contrast in team-building approaches. Some teams have embraced a diversified player profile, blending different skill sets across multiple clusters, while others rely heavily on one or two archetypes. Take EA7, for instance, they have a noticeable emphasis on playmakers and traditional bigs but lack representation from Cluster 7 (scoring big). It is no surprise the team ranks 14 out of 18 in two-pointers attempted per game. Zalgiris (ZAL) follows a similar trend, leaning into versatile wings and bigs while steering away from playmakers and scorers (clusters 4 & 5). The team is last in points scored per game. On the other hand, Maccabi (MTA) has a much more balanced spread across clusters, with an emphasis on Cluster 7 players. Logically, only Barcelona (BAR) makes more two-pointers that MTA on average per game.
Meanwhile, Real Madrid (RMB) and AS Monaco (ASM) have built their rosters without a true floor general, instead relying on high-usage shot creators and high-volume three-point shooters to drive their offenses. Their approach prioritizes offensive firepower and spacing over traditional playmaking and interior dominance. Players like Facundo Campazzo and Mario Hezonja for Madrid, and Mike James and Elie Okobo for Monaco, exemplify this philosophy, thriving as primary scorers rather than traditional facilitators.
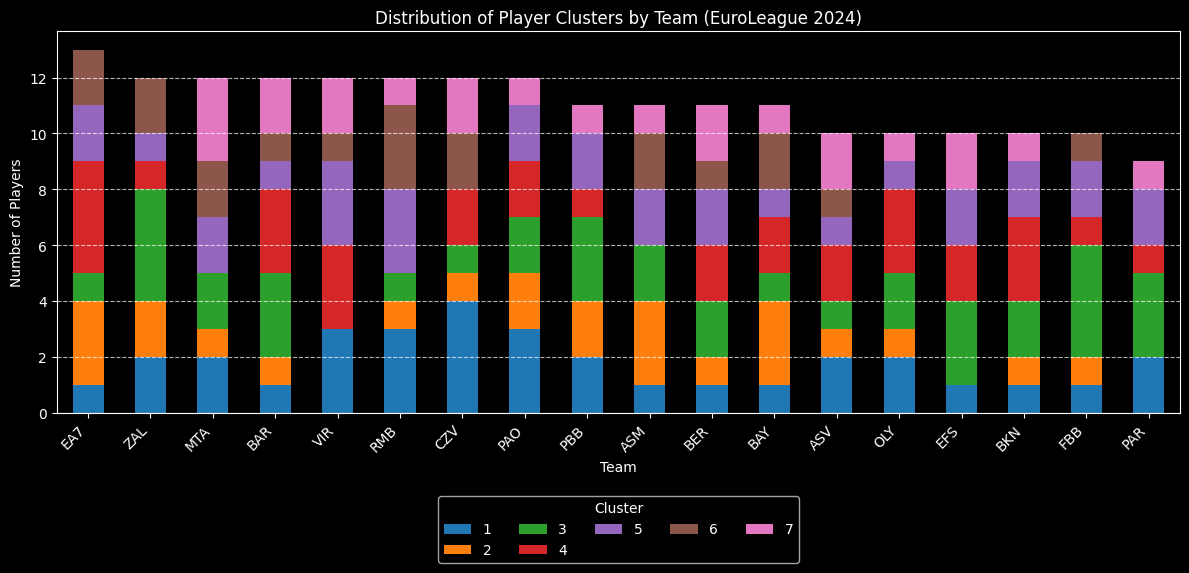
Partizan (PAR) and Fenerbahçe (FBB) exhibit an unusually high concentration of two-way forwards, lacking diversification across other player profiles. While this could suggest over-reliance on a specific playstyle, Fenerbahçe’s strong position in the standings challenges the idea that balance is always necessary for success.
This contrast raises a key question: does roster diversification actually correlate with better team performance? To answer this, we’ll analyze the last 10 EuroLeague seasons, using regression models to uncover whether certain roster structures consistently lead to success, or if adaptability and execution matter more than positional variety.
Does Roster Construction Shape Success?
To determine whether roster composition impacts team success, we built a dataset spanning the last 10 EuroLeague seasons. Using statistical clustering from the previous section, we classified players into positions for each season, then grouped teams based on their roster makeup and linked it to their winning percentage (W%) for that year.
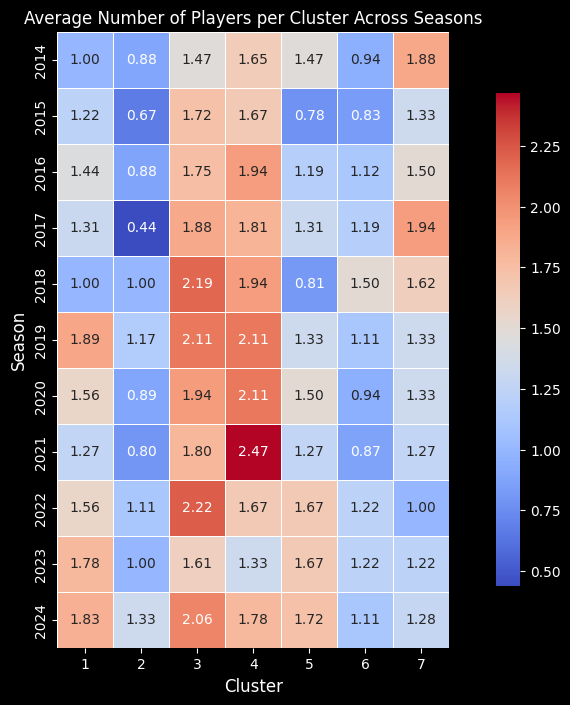
The heatmap highlights a clear shift in roster composition over the past decade, reflecting the evolution of modern basketball. Two-way forwards have become the most dominant position, emphasizing versatility on both ends of the floor. Meanwhile, traditional floor generals are declining, replaced by scoring guards who create their own shots rather than feeding the post. The fall of scoring bigs further reinforces this trend, as teams prioritize spacing and perimeter play over low-post scoring. Instead, bigs are now valued more for their rebounding and rim protection than offensive output.
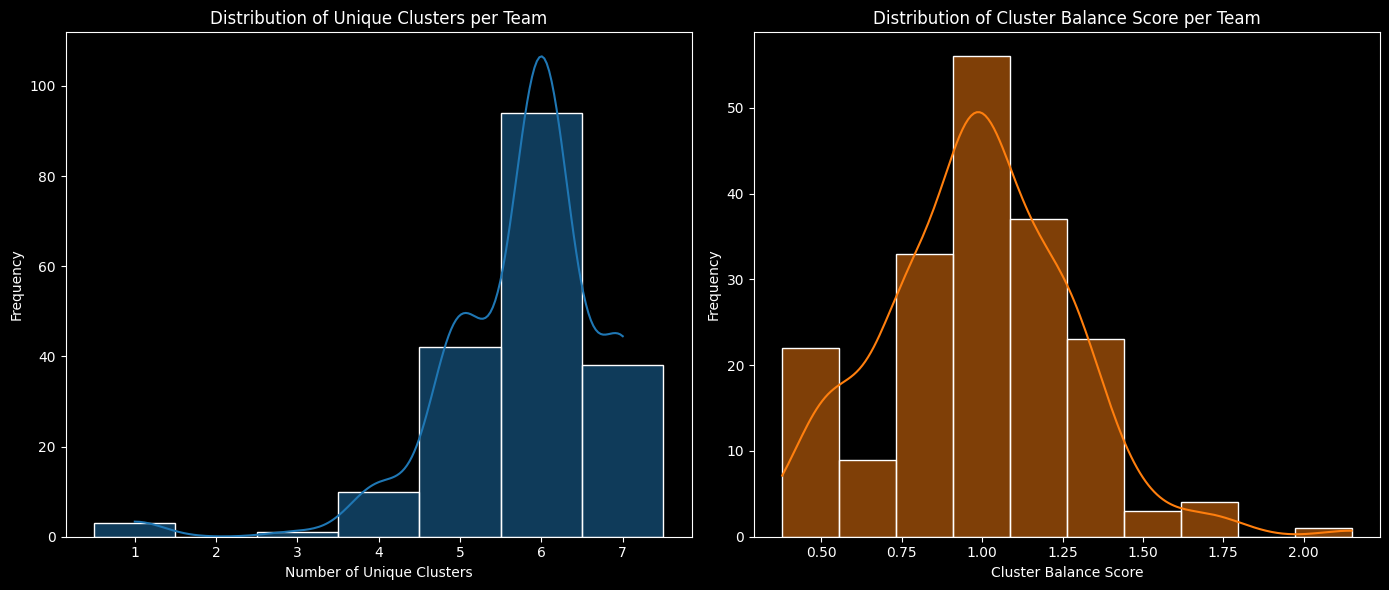
Obviously, not all teams construct their rosters the same way. To quantify these differences, we developed two key metrics. The Unique Clusters metric captures how many distinct player positions a team has in a given season, revealing its level of roster diversity. The Cluster Balance Score takes it a step further, measuring whether a team’s roster is evenly spread across multiple roles or built around a few dominant clusters. A high balance score suggests the team is structured around key roles with complementary pieces, while a lower score indicates a more evenly distributed lineup. Together, these metrics help us understand how teams shape their rosters and whether diversity and/or specialization leads to greater success.
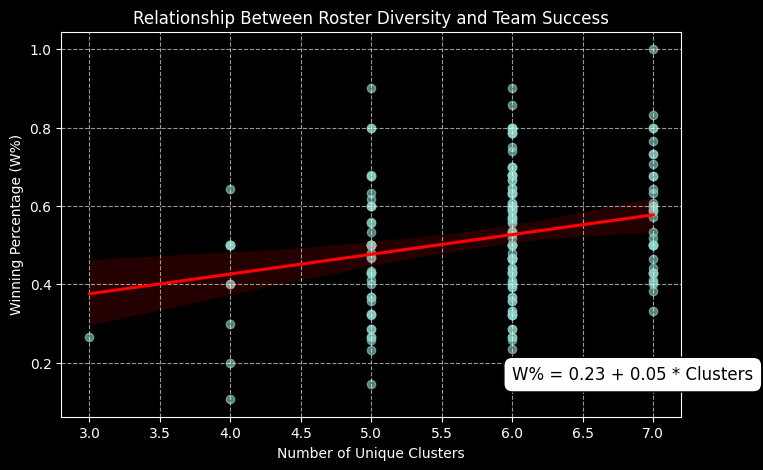
We ran a linear regression testing how the number of unique player positions and the balance of those clusters within a team correlate with winning percentage.
While the R-squared suggests that roster diversity alone doesn’t explain all of a team's success (which is expected given the complexity of basketball), both variables show statistically significant relationships with winning:
Individually, Unique Clusters is the stronger predictor of success, with a statistically significant relationship (p = 0.001) when analyzed on its own. However, when both metrics are included in the model together, Cluster Balance Score also becomes significant, suggesting that roster construction is a balancing act. Teams that maximize diversity and structure their lineups around a few key positions tend to perform better.
Interestingly, when only Unique Clusters is included in the model, its impact on W% drops from 8.1% to 5% (increased in win percentage per additional cluster), implying that part of its effect is shared with roster balance.
This reinforces the idea that while diversity in player positions is crucial, a completely even distribution across clusters is not necessarily optimal. Teams still need to lean into specific strengths rather than spreading talent too thinly.
What Does the Ideal Roster Look Like?
We’ve established that diversity in player positions matters, but the next question is just as important: What is the best way to build a winning roster?
Rather than assuming an ideal team structure, we let the data do the talking. We began by comparing the top and bottom 25% teams in terms of winning percentage to see if a clear trend emerged in roster construction.
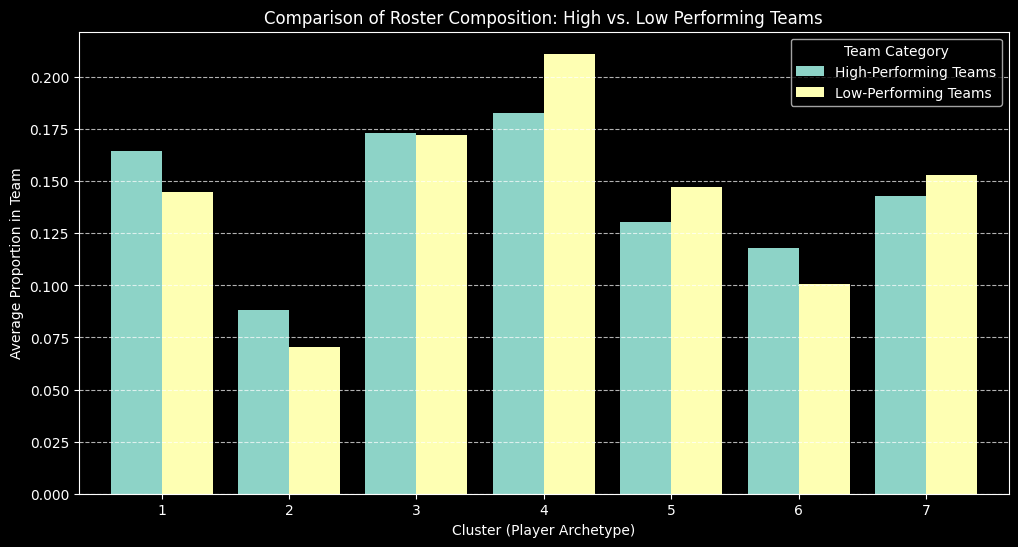
Surprisingly, successful teams don’t necessarily lean more on dominant ball scorers or scoring bigs. Instead, they show a clear preference for perimeter-oriented players, with higher proportions of Cluster 1 (Perimeter Threats) and Cluster 6 (High-Volume Three-Point Shooters). This aligns with the modern era of basketball, where spacing and outside shooting are paramount. Notably, there’s also a significantly lower reliance on classic floor generals, reinforcing the shift away from traditional playmaking toward a more fluid, three-point-driven offensive approach.
With 176 unique roster compositions out of 185 team-seasons in our dataset, it became clear that nearly every team constructs its lineup in a distinct way. But are there patterns among the most successful teams? To push our analysis further, we clustered these roster compositions into 6 groups, to identify which ones correlated with the highest winning percentages. By grouping similar roster structures, we aimed to uncover whether certain lineup formulas have consistently driven success over the past decade.
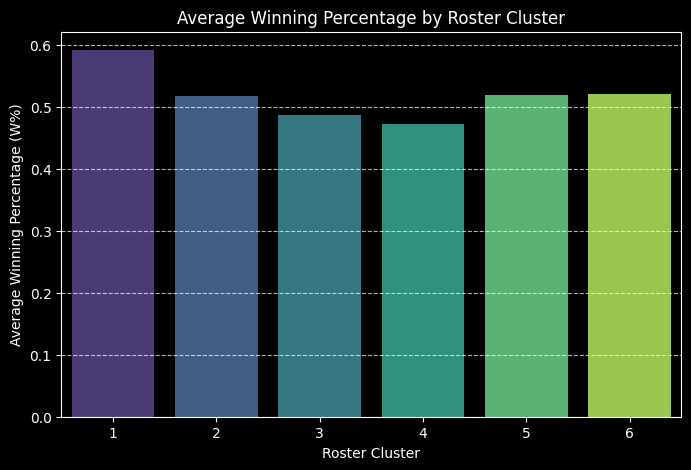
The results confirms once again that not all roster compositions are created equal, with some structures consistently lead to higher winning percentages. The most successful roster cluster stands out with a clear edge, reinforcing the idea that certain team constructions are better suited for success. However, to truly understand why these clusters perform better, we need to break down their composition. Next, we’ll dive into what defines each cluster and which player positions are driving success.
The highest-performing roster cluster stands out as a unique case, featuring an unusually high concentration of High-Usage Scorers (Cluster 5), High-Volume Three-Point Shooters (Cluster 6), and Scoring & Rebounding Bigs (Cluster 7). This mix suggests that while high-scoring players play a critical role, they are most effective when complemented by strong outside shooting.
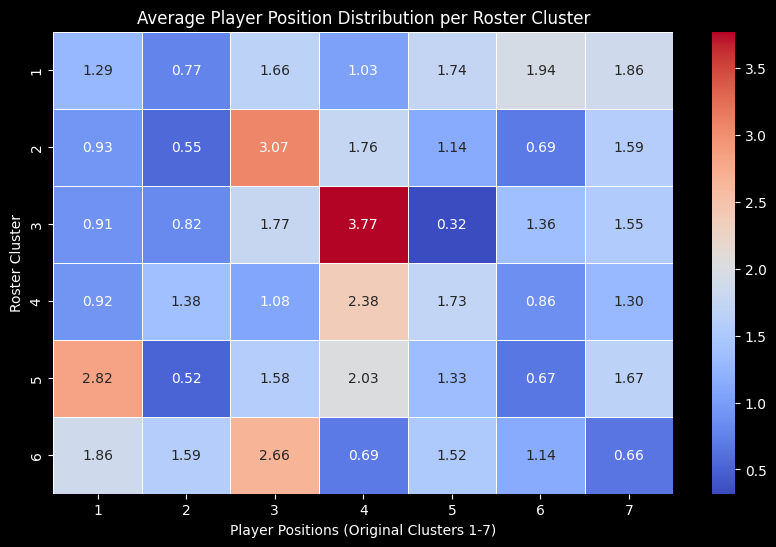
However, the heatmap makes it clear that Player Cluster 5 alone does not guarantee success. After the top-performing roster cluster, Roster Cluster 4 has the next highest concentration of High-Usage Scorers (1.73 Cluster 5 players on average). Yet, it is among the least successful roster compositions, largely due to its lack of perimeter shooting threats, both Perimeter Threats (Cluster 1) and High-Volume Three-Point Shooters (Cluster 6) are underrepresented. A similar pattern appears in Roster Cluster 2, which also struggles despite a high number of scoring options.
Another key takeaway is Roster Cluster 3, which is structurally very different from the others. Despite featuring a solid presence of Two-Way Forwards (Cluster 3)—offering defensive versatility, and a decent balance of Scoring Bigs (Cluster 7) and High-Volume Three-Point Shooters (Cluster 6), the key weakness is in the backcourt. Nearly all guards in this cluster are Floor Generals (Cluster 4), with an average of less than 0.35 High-Usage Scorers (Cluster 5). This once again suggests that this traditional playmaking-heavy structure might no longer be effective in modern basketball, as teams are shifting away from pass-first guards and towards dynamic scorers who can create for themselves.
In summary, our analysis confirms that roster construction is a significant driver of success in the EuroLeague, but not in the way traditional basketball wisdom suggests. By applying clustering techniques to classify players based on skills rather than positions, we uncovered seven distinct positions that better reflect the modern game. Regression analysis further revealed that while roster diversity is crucial, balance is not the key. Successful teams concentrate talent in key roles rather than evenly distributing player types.
The most effective rosters prioritize perimeter threats and high-volume three-point shooters over traditional playmakers and post-heavy offenses. Simply stacking elite scorers doesn’t guarantee success; instead, winning teams blend offensive firepower with floor spacing and defensive versatility. Our historical clustering of rosters over the past decade identified clear formulas for success while exposing outdated team structures that struggle in today’s pace-and-space era.
The takeaway for EuroLeague front offices? The future of roster construction isn’t just about acquiring talent, it’s about data-driven precision, structuring teams around the right mix of skills rather than outdated positional labels.
Sources: EuroLeague Stats, Eurobasket
Disclaimer: The essence of data analysis is not to capture the entirety of the story but to piece together a narrative from the data fragments at hand. While the data utilized herein is robust and comprehensive, it's not exhaustive. Every statistical representation has its constraints. Our aim is to utilize accessible data judiciously, aiming for an honest and insightful interpretation, recognizing that there are always more layers to the story.