


Moneyball's 20th Inning: Does the Game-Changing Strategy Still Score?

Twenty years ago, the landscape of Major League Baseball (MLB) was forever altered by the implementation of a novel strategy that came to be known as "Moneyball." Popularized by Michael Lewis's 2003 book "Moneyball: The Art of Winning an Unfair Game," and further immortalized by the subsequent film adaptation, the Moneyball theory turned the traditional baseball world on its head.
The core of the Moneyball theory posited that On-base Percentage (OBP) was an undervalued metric in determining a player's contribution to a team's success, more so than the traditionally favored batting averages and runs batted in.
In their groundbreaking study, "An Economic Evaluation of the Moneyball Hypothesis", researchers delved into the relationship between team success—measured by winning percentage—and players' OBP and SLG, shedding light on the economic efficiencies gained from this approach. Crucially, they also examined the relationship between player salaries and OBP before and after the book was published, offering insights into the market's valuation of player contributions.
Two decades on, this post aims to re-evaluate the Moneyball hypothesis in light of the last 23 seasons (2000-2022). We will examine whether OBP continues to hold its place as a more crucial indicator of team success compared to SLG, and introduce Isolated Power (ISO) into our analysis as a modernized slugging metric that specifically measures a hitter's raw power.
Furthermore, with the advent of advanced analytics like Statcast, which offers a treasure trove of player performance data, we are poised to assess the validity of Moneyball's principles in today's game. Lastly, we'll conduct a correlation analysis between team payroll and OBP alongside more advanced metrics to determine what is currently valued by MLB franchises.
Reassessment of Moneyball Metrics (2000-2022)
Utilizing publicly available game logs from Retrosheet, we transformed raw text files into a structured dataframe (note: The information used here was obtained free of charge from and is copyrighted by Retrosheet. Interested parties may contact Retrosheet at "www.retrosheet.org").
Once the raw data was structured, we created binary variables to reflect home and away wins. Given that teams can be either the home or the away team, it was necessary to aggregate their statistics separately for each context. This dual aggregation approach allowed us to prepare a dataset for further analysis, capturing all home and away records for each team in every season.
The key statistics for On-base Percentage (OBP) and Slugging Percentage (SLG) were computed using the following formulas:
OBP is calculated as
\((H+BB+HBP) / (AB+BB+HBP+SF)\)where:
H is Hits
BB is Bases on Balls (Walks)
HBP is Hit By Pitch
AB is At Bats
SF is Sacrifice Flies
SLG is calculated as
\((1B+2*2B+3*3B+4*HR) / AB\)where:
1B, 2B, 3B, and HR represent singles, doubles, triples, and home runs, respectively.
By merging the home and away statistics, we constructed a dataset to analyze each team's performance over multiple seasons, incorporating these vital batting statistics. The calculated team OBP and SLG, both for and against, were pivotal in recreating the analytical framework used by Hakes and Sauer in their study.

When contrasting contemporary analysis using data from the last 23 seasons with research conducted between 1999 and 2003 (above), the importance of OBP over SLG in determining a team's winning percentage persists, albeit with nuanced differences. The more recent findings continue to validate OBP as a stronger contributor than SLG to winning games, evidenced by its larger coefficient in the models. However, there has been a slight decline in the coefficient values for OBP as well as a marginal reduction in the R-squared values, indicating a somewhat diminished but still significant predictive power for winning. Even after including a metric like Isolated Power (ISO), the raw power of a hitter by taking only extra-base hits and the type of extra-base hit into account, the combination of the three metrics accounts for about 82.7% of the variation in win percentage (no improvement) where ISO’s coefficient is 0.47.

The advent of advanced metrics like xSLG and wOBA may shed light on the observed decrease in R-squared and the coefficients for traditional stats. In the following section, we'll investigate how these modern analytical tools might offer explanations for these changes and provide fresh insights into baseball's winning formula.
Moneyball in the Statcast Era (2015-2022)
As baseball analytics have evolved, so too have the metrics used to dissect and understand the game's underlying factors that contribute to winning. The incorporation of cutting-edge Statcast metrics such as expected batting average (xBA), expected slugging percentage (xSLG), expected weighted on-base average (xwOBA), and expected wOBA on contact (xwOBACON) has opened up new avenues for analysis.
Yet, after trying multiple combinations and having introduced interaction terms (difference between the metric and its expected value, e.g. SLG - xSLG), these sophisticated metrics have not eclipsed the explanatory power of OBP in the context of winning percentage. It appears that the ability of OBP to signify a player's proficiency in reaching base still plays a pivotal role in shaping a team's success. As we continue to refine our regression models and integrate these advanced stats alongside traditional ones, it is becoming apparent that the search for a metric with as much predictive power as OBP is an ongoing quest in the era of modern baseball analytics.
The “Launch Angle” Revolution
In recent years, baseball has become interestingly obsessed with launch angles, with hitters optimizing their swings to achieve a higher trajectory on batted balls, aiming for more home runs and extra-base hits. This approach has altered traditional hitting philosophies and has been linked to the surge in home run rates across the major leagues. By leveraging sophisticated tracking technology from Statcast, metrics such as launch angle, exit velocity, and barrel percentage have become crucial in evaluating a player's ability to produce high-value hits.
The subsequent section will delve into the correlation between these modern metrics and winning percentage, examining if and how they contribute to a team's success. By analyzing these relationships, we aim to uncover potential advantages in player evaluation that extend beyond the traditional reliance on OBP. To do so, we used data from Baseball Savant (Statcast) over the last 9 seasons including the most recent regular season.

The launch angle determines the initial trajectory of the ball after being hit. A balanced launch angle is crucial; too low could lead to groundouts, and too high might produce easy flyouts. Its correlation coefficient with winning percentage is 0.264750, which is a weak to moderate positive correlation. This suggests that while an optimized launch angle does have a positive impact on winning, it is not as strong a predictor as exit velocity or barrel percentage, especially given the fact that too high angles (resulting in flyouts) detract from a team winning percentage.

Exit velocity gauges how hard a ball is hit, with higher exit velocities generally leading to more successful hitting outcomes. The correlation coefficient of 0.415538 with winning percentage is a notable positive correlation, implying that teams whose players consistently hit the ball with high exit velocities are more likely to have higher winning percentages, perhaps due to increased chances of hits and home runs.

Barrel percentage measures the frequency of a batter's ideal contact—hard and at an optimal angle, a combination of the above metrics. A higher barrel percentage indicates a batter who regularly makes the type of contact that leads to extra-base hits. The correlation coefficient of 0.356148 with winning percentage suggests a moderate positive relationship, indicating that teams with players who achieve higher barrel percentages tend to have better winning records.
The negative correlation between Ground Ball Percentage (GB%) and winning percentage further emphasise the above. With a correlation coefficient highlighting an inverse relationship (-0.277288), it is evident that teams with a lower GB%, implying a lesser frequency of ground balls, tend to win more games. As teams and players adapt, it becomes increasingly clear that those who master the art of the launch angle combined with high exit velocity, not only excite with soaring home runs but also significantly contribute to their team's success.

Financial Analysis: Payroll vs. Performance
In the evolving landscape of baseball's analytical era, a discernible trend has emerged in the correlation between team payrolls and key performance metrics. The data from 2015 to 2023 illuminates a progressive valuation of OBP and barrel percentage among MLB teams. While OBP consistently signified a player's aptitude for reaching base, its correlation with team payrolls saw a noteworthy climb up to 2022, suggesting that teams have been increasingly willing to invest in players proficient at avoiding outs.
Meanwhile, barrel percentage has also risen in correlation with payrolls, peaking in 2022. This underscores a strategic shift towards players capable of generating impactful hits. The marked dip in OBP correlation in 2023 juxtaposed with the still robust, albeit reduced, link with barrel percentage could reflect a nuanced balance in team investments, marrying on-base skills with the power and precision heralded by the launch angle revolution.
As teams navigate through the data-driven waves of modern baseball, these correlations with payroll expenditures reveal a compelling narrative of evolving priorities, with the 2020 season standing out as an anomaly likely influenced by the unprecedented circumstances of the pandemic.

On average, teams have spent approximately $132.36 million in total payroll for a near-even win percentage of 49.82% over the last 9 seasons, and a positive correlation between winning percentage and total payroll is observable.
Yet, the Tampa Bay Rays have notably defied this trend. Despite having the lowest average payroll in the league, a modest near $70 million, the Rays have consistently outperformed expectations, securing an average win percentage of close to 55% well above the break-even point of 50%, reminiscent of the early 2000s Oakland Athletics narrative that gained widespread attention with the release of "Moneyball".
Like the A's, the Rays have demonstrated that a team doesn't need the financial firepower to outscore their competitors; they can also win through intelligent management and a keen eye for undervalued talent. By prioritizing metrics that other teams may overlook, Tampa Bay has consistently achieved a winning percentage that defies the expectations set by their modest payroll, the lowest in the league over the period.

In the two decades since "Moneyball" popularized the use of OBP as an undervalued metric for building competitive baseball teams, the landscape of talent acquisition in MLB has significantly evolved. High OBP players are now widely recognized for their value and are consequently well-compensated. This shift has particularly impacted teams with lower budgets, which can no longer easily compete for such talent without exceeding their financial constraints.
However, these financially constrained teams sometimes show proficiency in metrics that could indicate a focus on efficiency or specific skill sets that are undervalued in the market. For instance:
The Tampa Bay Rays (TBA), with the lowest payroll ranking at 30, show a relatively strong performance in the wOBA and wOBACON at rank 11 and 5 respectively, which are considered more sophisticated metrics that estimate a player's overall offensive value. TBA ranks amongst the best in quality of hit metrics like barrel percentage and exit velocity.
The Oakland Athletics (OAK), with the second-lowest payroll at rank 29, have the best ranking in launch angle, suggesting a strategic approach to hitting that emphasizes optimal ball flight paths for better results, despite not leading in traditional hitting metrics.
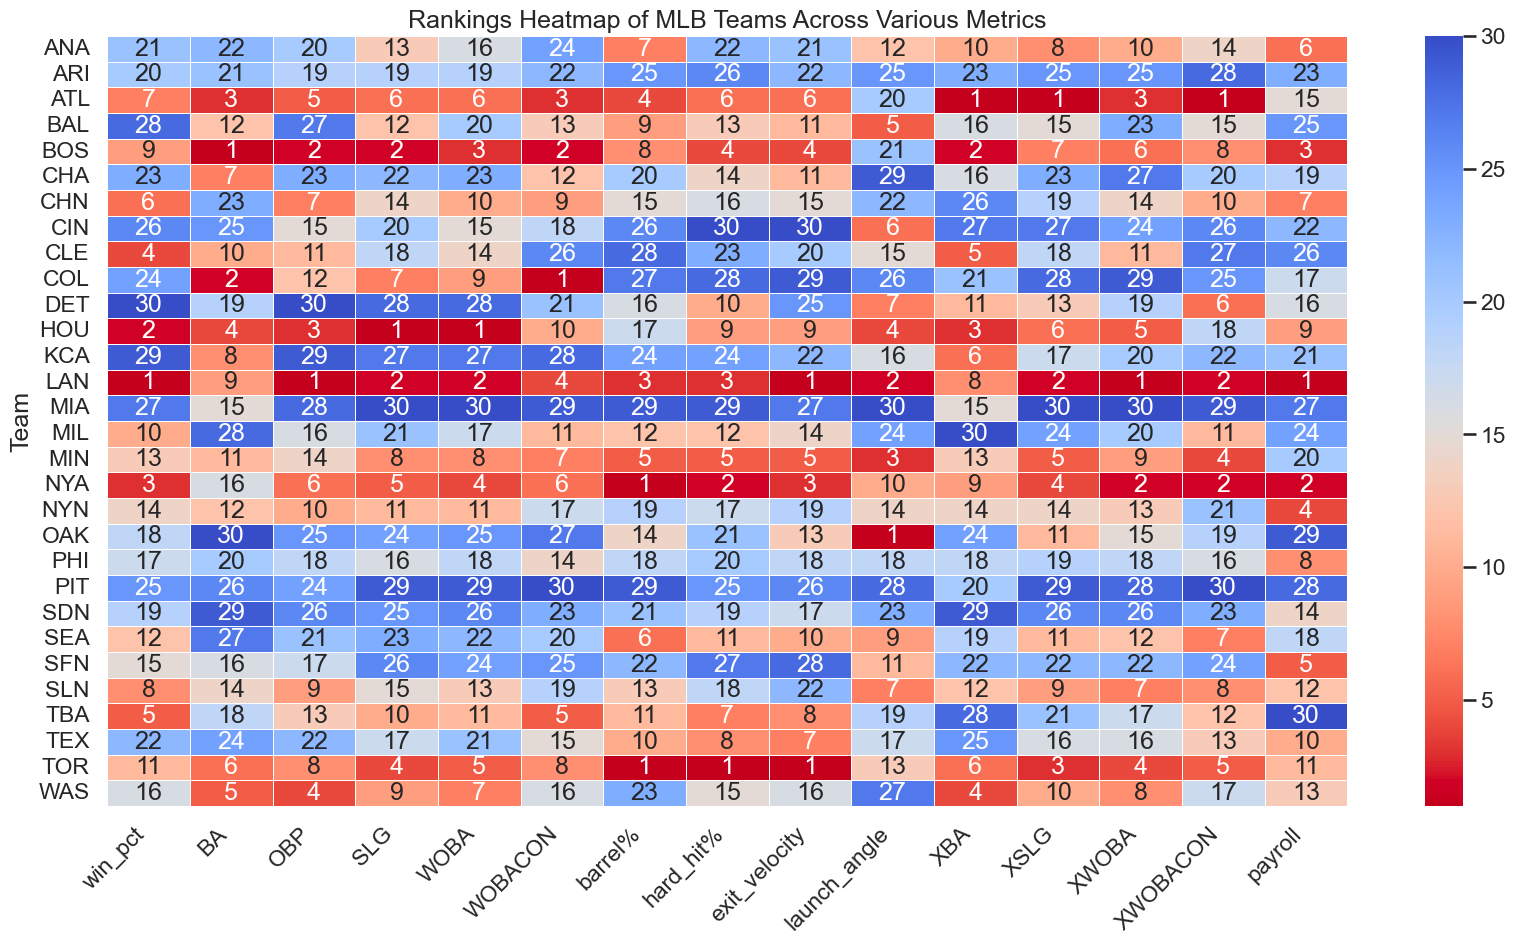
In summary, as more sophisticated and advanced metrics become available, they open new avenues for low-budget teams to compete. By shifting focus from the now highly valued OBP to under appreciated aspects of hitting like launch angle and barrel percentage, these teams continue to challenge richer clubs, finding novel ways to assemble competitive rosters in the ever-evolving game of baseball sabermetrics.
In conclusion: the Moneyball revolution that took root two decades ago continues to shape the landscape of Major League Baseball. While the importance of OBP over SLG in determining a team's success remains evident, the modern era of advanced analytics has introduced a new layer of complexity to player evaluation. Metrics like launch angle, exit velocity, and barrel percentage are now new factors in understanding a player's ability to contribute to their team's winning percentage.
The correlation between these modern metrics and winning percentage highlights the evolving nature of the game, where a balance between on-base skills and power-hitting precision is becoming increasingly important. Teams are reevaluating their investments, and the correlation between player performance and payroll expenditure reveals a dynamic narrative of shifting priorities.
Notably, the Tampa Bay Rays, much like the Oakland Athletics in the Moneyball era, have shown that a strategic focus on undervalued metrics can lead to success even with a lower payroll. In this ever-evolving world of baseball sabermetrics, low-budget teams are finding innovative ways to compete by harnessing the power of advanced analytics.
Disclaimer: The essence of data analysis is not to capture the entirety of the story but to piece together a narrative from the data fragments at hand. While the data utilized herein is robust and comprehensive, it's not exhaustive. Every statistical representation has its constraints. Our aim is to utilize accessible data judiciously, aiming for an honest and insightful interpretation, recognizing that there are always more layers to the story.